Abstract
Objective: Glycemic variability (GV) is associated with increased morbidity and mortality in critically ill patients. This study aimed to contribute to the knowledge on the subject and to investigate the situation in our intensive care patient population.
Method: Patients who were admitted to the Intensive Care Unit (ICU) between January 2015 and August 2020 were screened using the hospital’s database. The following data were collected: demographic characteristics of the patients, comorbidities, APACHE II scores, SOFA scores, mean amplitude of glycemic excursions (MAGE) based on daily blood glucose measurements from the first day of ICU admission until discharge up to the 28th day of their stay, length of stay (LOS), and 28-day mortality status.
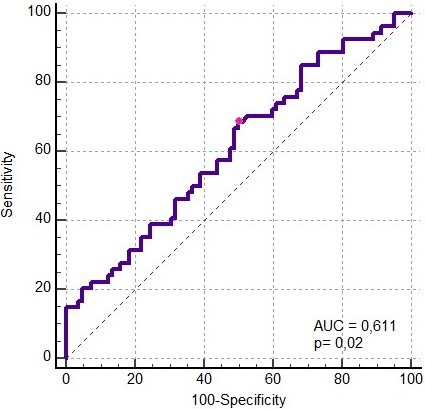
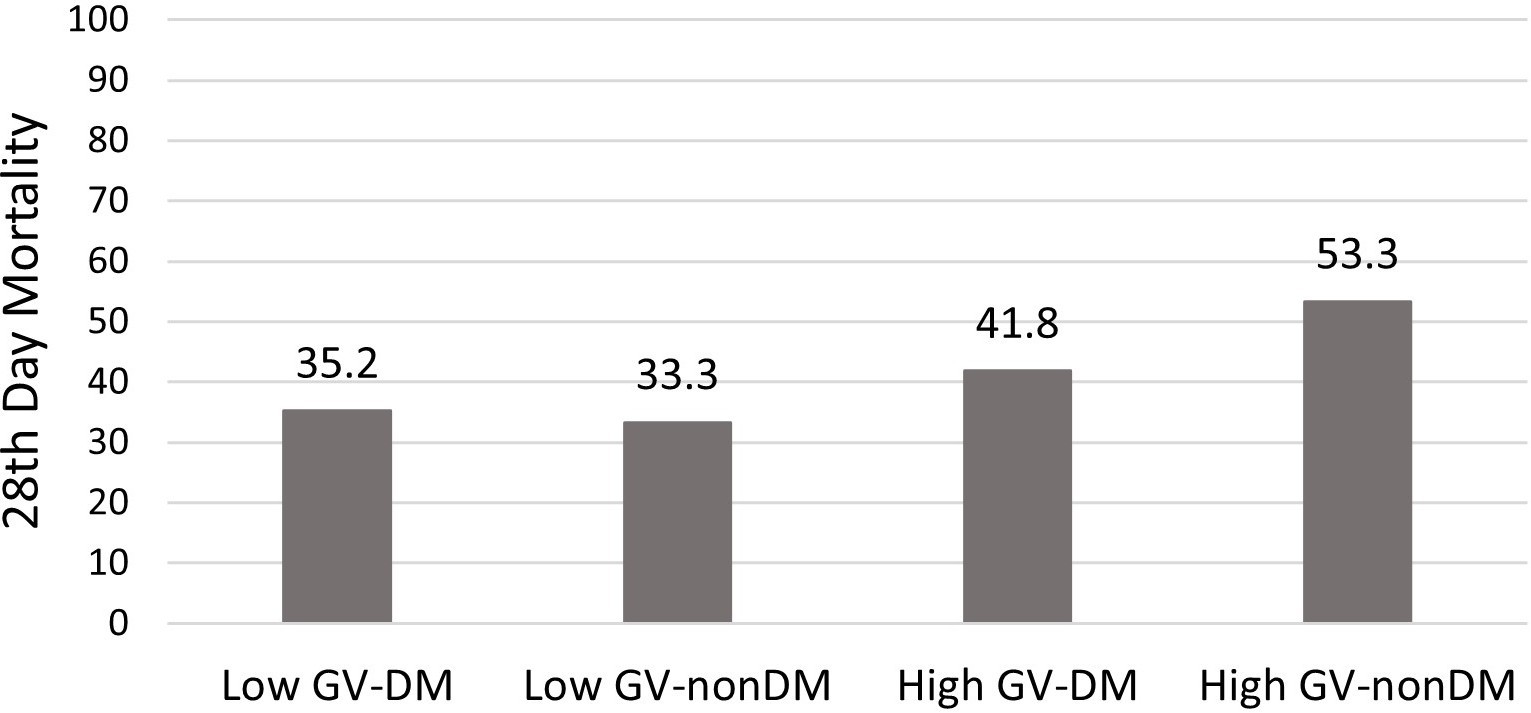
Results: In this study, 136 patients were enrolled and divided into high (n=70) and low GV (n=66). No differences were found between the two groups in terms of age, gender, comorbidity, APACHE II, mean SOFA scores, treatments, ICU LOS, and mortality. MAGE was higher in nonsurvivors (78.8 ±32.2) compared to survivors (65.4 ±22.5) (t=-2.78, p= 0.005). Regarding the mortality, the AUC value for GV was 0.611 (p=0.02) for MAGE >61 mg/dl, with a sensitivity of 68.5% and specificity of 50%. Patients were grouped according to GV (MAGE>65) and the presence of diabetes mellitus (DM). Mortality was highest in patients with high GV and without DM (53.3%).
Conclusion: In this study, MAGE levels were higher in non-survivors than survivors, and glycemic variability was moderately associated with mortality. Patients with high GV and without DM had a higher mortality rate compared to those with DM.
Keywords: glycemic variability, critically ill, mortality
Introduction
Numerous metabolic abnormalities that critically ill patients experience can have a major effect on their clinical fate. Maintaining glycemic control, which has been demonstrated to lower morbidity and mortality, is an essential part of their care (1). Intensive Care Unit (ICU) patients frequently have hyperglycemia, which is associated with an increased risk of infection, longer hospital stays, and higher mortality (2,3). Hypoglycemia has been shown to have adverse effects on these patients too (4,5). Attentive glycemic control is advised to avoid the negative consequences of both hypoglycemia and hyperglycemia. The American Diabetes Association (ADA) recommends targeting blood glucose levels between 140 and 180 mg/dL in critically ill patients (6), while the Society of Critical Care Medicine (SCCM) recommends maintaining blood glucose levels between 110 and 150 mg/dL (7).
Blood glucose variations that deviate from the desired range are known as glycemic variability (GV). The stress reaction to severe illness is one of the main causes of GV (8). Studies have shown that higher GV is associated with increased morbidity and mortality, longer hospital stays, and a higher risk of infections (9-11). GV can occur due to several causes. These include the type and timing of nutritional support, the presence of comorbidities, the severity of the illness, and the use of drugs such as vasopressors and corticosteroids (4). In order to reduce GV in ICU patients, it is imperative to recognize and control these factors.
This study was conducted to understand GV status in our patient population. The primary objective was to investigate the relationship between glycemic variability (GV) and mortality in patients admitted to the ICU. Additionally, the effects of potential risk factors on GV were analysed.
Method
The hospital database was used to do a retrospective screening of patients hospitalized to the Internal Medicine Intensive Care Unit between January 2015 and August 2020.
Patient’s demographics, comorbid conditions, Acute Physiology and Chronic Health Evaluation II (APACHE II) scores (12) and their corresponding predicted mortality rates (APACHE II-PMR); Sequential Organ Failure Assessment (SOFA) scores (13) at ICU admission; and information on the use of insulin, corticosteroids, vasopressors, and beta-blockers were documented, as were the ICU length of stay (LOS) and 28-day mortality status. As an institutional protocol, blood glucose had been measured at least 4-6 times daily using a bedside glucose analyser. Samples were taken from capillary blood. Following international guidelines, the target blood glucose range in the intensive care unit was 140-180 mg/dL (6). Insulin administration was managed protocol- based on these targets. All patients received nutritional support to meet their daily caloric needs of 25-30 kcal/kg.
Blood glucose values were recorded from the first day of admission to the intensive care unit until discharge, up to a maximum of 28th days of their intensive care unit stay. The mean amplitude of glycemic excursion (MAGE) index was used to determine glycemic variability. The MAGE index is calculated by measuring the difference between the peak and trough glycemic excursion over 24 hours. The MAGE index was calculated using the formula: MAGE = 1/n * ∑ |G[i] - G[j]|, where G[i] and G[j] represent the glucose values at two consecutive peaks or nadirs, and n is the total number of peaks and nadirs that meet the threshold criteria. Then, the average of daily MAGE indices was calculated (Sum of daily MAGE/ICU stay). Referring to a previous study (14), high GV was defined as a MAGE >65 mg/dL.
This study received approval from the Trakya University Clinical Research Ethics Committee (TÜTF-BAEK 2020/438, 07.12.2020). Written informed consent was obtained from the participants’ legal guardians or next of kin. According to the study clinic’s regulatory procedures, patients or their legally authorized relatives provided written consent for ‘processing and publishing patients’ medical records (with names disclosed) for scientific purposes.’
Statistical analyses
IBM SPSS version 26.0 (IBM Corporation, Armonk, NY) was used for statistical analyses. Descriptive statistics were presented as counts (percentages) for categorical variables and medians [25th-75th percentiles] for numerical variables. Baseline characteristics, scores, and outcomes were compared between low and high GV groups using Chi-square tests and Fisher’s exact tests for categorical variables, and the Mann-Whitney U test for numerical variables where appropriate. The receiver operating characteristic (ROC) curve was employed to assess the predictive prognostic value of the MAGE index. A 5% type-I error rate was applied to determine statistical significance.
Results
Medical records of 612 patients admitted to the ICU between January 2015 and August 2020 were reviewed. In total, 136 patients whose medical records were fully accessible were included in the study. Demographic characteristics (age, gender), comorbidities, SOFA, APACHE II and APACHEII-PMR at the ICU admission; use of insulin, corticosteroid, vasopressor, and beta-blocker therapy, length of stay, and 28-day mortality status of the patients are shown in Table 1. The median age was 71 [63-77] years. Men were in the majority (57.4%). One hundred six (77.1) patients had diabetes mellitus (DM), which was the leading comorbidity. The median APACHE-II score was 22 [16-29]. The median MAGE index was 66.7 [50.0-87.5]. ICU length of stay was 9.5 [6.0-27.5] days. In-hospital mortality was 39.7%. According to the APACHE-II predicted mortality, the standardised mortality ratio was 0.93 (95% CI: 0.68-1.17).
| Definition of abbreviations: GV: Glycaemic variability, MAGE: mean amplitude of glycaemic excursions, DM: Diabetes mellitus, SOFA: Sequential organ failure assessment, APACHE II: Acute Physiology and Chronic Health Evaluation, PMR: Predicted Mortality Ratio. Data was expressed as n (%) and *: median [25-75th percentiles]. | ||||
| Table 1. Characteristics of the patients categorized by glycaemic variability | ||||
|
|
|
|
|
|
| Age. years * |
|
|
|
|
| Gender. Male (n, %) |
|
|
|
|
| Comorbidities, (n, %) | ||||
| DM |
|
|
|
|
| Type-1 |
|
|
|
|
| Type-2 |
|
|
|
|
| Chronic Pulmonary Disease |
|
|
|
|
| Cerebrovascular Disease |
|
|
|
|
| Malignity |
|
|
|
|
| Chronic Renal Disease |
|
|
|
|
| Chronic Liver Failure |
|
|
|
|
| Cardiovascular System |
|
|
|
|
| Hypothyroidism |
|
|
|
|
| SOFA score |
|
|
|
|
| APACHE II* |
|
|
|
|
| APACHE-PMR * |
|
|
|
|
| Average MAGE* |
|
|
|
|
| Therapies | ||||
| Corticosteroid |
|
|
|
|
| İnsulin |
|
|
|
|
| Vasopressor |
|
|
|
|
| Beta-blocker |
|
|
|
|
| ICU Length of Stay * |
|
|
|
|
| Mortality (n. %) |
|
|
|
|
Patients were categorised into low or high GV groups according to the MAGE index and compared (Table 1). Groups were not different in terms of age, gender, comorbidities, or scores. Insulin therapy was used more frequently in patients with high GV (74.3%) than in patients with low GV (36.4%) (p<0.001).
The length of stay in the ICU and hospital mortality did not differ between the low and high GV groups. However, MAGE was higher in nonsurvivors (78.8 ± 32.2) compared to survivors (65.4 ± 22.5) (t = -2.78, p = 0.005). In the ROC analysis for predicting mortality based on GV, the AUC was 0.611 (p = 0.02) (MAGE > 61 mg/dl, Sensitivity 68.5%, Specificity 50%) (Figure 1).Mortality was compared by grouping patients according to GV (MAGE>65) and the presence of DM. (Figure 2) Mortality was highest in patients with high GV and without DM (53.3%).
Discussion
This study showed that MAGE was higher in non-survivors than survivors, and glycemic variability moderately predicted mortality. Patients with high glycemic variability and without DM had higher mortality than patients with DM. Glycemic variability was associated with insulin therapy.
The management of glycaemia in critically ill patients has been the subject of extensive research and controversy over the years. Although it’s well known that hyperglycemia is a compensatory mechanism to provide sufficient substrate to vital organs as a stress response (8), its association with increased morbidity and mortality has been documented (2,3). However, adverse outcomes and increased mortality have been reported in randomised trials evaluating the efficacy of tight glycemic control. (15) Several factors, such as optimal glycemic targets, risk of hypoglycemia, glycemic variability, appropriate target populations, and insulin infusion protocol, have complicated this issue. Recent studies have also highlighted the importance of each patient’s pre-existing glycemic milieu, further complicating the determination of appropriate glycemic thresholds (16,17).
Studies have shown that there is a correlation between GV and mortality in critically ill patients. (10,18-20) GV was also found to be more strongly associated with mortality than hyperglycemia and hypoglycemia in the paediatric population (21). This association of glycaemic variability with mortality is initiated by increased oxidative stress, neuronal damage, mitochondrial damage, and coagulation activity, as in hyperglycemia (19,22,23).
Many indices are used in evaluating glycaemic variability, such as MAGE, glucose variability index (GVI), glycemic lability index (GLI), coefficient of variation (CV), continuous overlap-ping net glycemic action (CONGA), and mean of daily differences (MODD) (24). In this study, we used the MAGE index with a cut-off value of 65 to group patients as high and low GV, referring to a study by Service et al. (14) Similar to our study, Chao et al. also used this cut-off value (10). In their study, they calculated MAGE on the first day of ICU admission in patients with sepsis and examined its relationship with mortality in this patient group. The results showed a higher mortality rate of 36.7% in patients with high GV than in patients with low GV, who had a mortality rate of 26.6%. They also found a correlation between GV and 30-day mortality using Kaplan-Meier analysis (log-rank test, p=0.018). Our study differs from Chao et al.’s in that we did not focus on a specific group of patients. We also utilized the mean of daily MAGE indices measured daily during the ICU stay to group the patients. This may explain our finding that glycemic variability predicted mortality moderately.
Our findings align with a recent systematic review and meta-analysis by Hyrciw et al., which included 41 studies investigating the association between GV and short-term mortality in intensive care patients (25). This meta-analysis found a consistent association between increased measures of glycemic variability and higher short-term mortality. In studies where MAGE was used, MAGE was 0.24 mmol/L higher (95% CI: –0.23 to 0.70) in patients who died compared to survivors. Additionally, for every 1 mmol/L increase in MAGE, the adjusted odds of mortality increased by 4% (aOR: 1.04; 95% CI: 1.01–1.08), while patients in the highest quartile of MAGE had a 61% higher risk of mortality than those in the lowest quartile (aOR: 1.61; 95% CI: 1.01–2.56). These findings emphasize that higher glycemic variability, as measured by MAGE, is associated with an increased risk of mortality in critically ill patients. Although the certainty of the evidence is low and should be interpreted cautiously, this reinforces the importance of monitoring and minimizing glycemic variability as a potential strategy to improve patient outcomes.
In our study, non-diabetic patients with high glycaemic variability had higher mortality than diabetic patients. Krinsley et al. conducted a crucial study that compared the impact of glycaemic variability on mortality in critically ill patients who were grouped based on their DM status (26). In this study, mean capillary blood glucose level (MGL) and coefficient variation (%, standard deviation/MGL) measured during ICU stay were used to assess GV. Supporting the results of our study, GV was found to have a strong and independent relationship with mortality in patients without DM, whereas this relationship was not found in patients with DM. The mechanism of high glycemic variability may have a worse effect on the survival of non-diabetic patients than those with DM during critical illness is not well known. Patients with DM may have developed a tolerance to the cellular and microvascular complications caused by high blood sugar levels. On the other hand, sudden changes in glucose levels may trigger a cytokine storm in patients without DM. Additionally, non-diabetic patients may require a higher release of cytokines or hormones than diabetic patients in response to the same level of glucose change, which could be linked to the severity of the disease and the risk of mortality. Our study found no difference between APACHE-II in high and low GV groups. Although this supports the hypothesis of tolerance to glycaemic complications, we cannot make a clear statement since we did not perform multivariable logistic regression analysis.
The study has limitations that need to be considered while interpreting the results. First, the retrospective nature of the study inherently limits control over data quality and the capacity to account for all potential confounders. Second, the relatively small sample size may restrict the generalizability of the results. Furthermore, although nutritional support was provided to meet daily caloric requirements (25–30 kcal/kg/day), patients could not be consistently categorized according to the route of nutrition (enteral or parenteral) due to practical constraints in adhering to a single method throughout the ICU stay. This variability in nutritional strategies may have impacted glycemic variability and mortality outcomes. Additionally, the number and timing of blood glucose measurements were not standardized. Measurements were conducted four to six times daily, based on clinical requirements, with adjustments made according to the patient’s condition. On the other hand, irregular timing may affect the precision of variability evaluations, and fewer measurements may result in an underestimation of glycemic variability. Because of variations in metabolic reactions and dietary factors, acute and chronic stages of illness may show different patterns of glycemic fluctuation. These limitations will be addressed in future prospective studies that examine feeding patterns and routine blood glucose testing schedules. Lastly, the study did not account for possible confounding variables that can impact glycemic control, such as the severity of the condition and the use of other drugs. In conclusion, this study highlights the importance of GV as a determinant of mortality in critically ill patients; a higher GV is associated with an increased risk of death, which is particularly evident in non-diabetic patients. These findings contribute to the ongoing debate about glycemic management in critical care. Future researchs should focus on developing strategies to reduce GV in critically ill patients.
Ethical approval
This study has been approved by the Trakya University Faculty of Medicine Scientific Research Ethics Committee (approval date: December 7, 2020, number: 20/03). Written informed consent was obtained from the participants.
Source of funding
The authors declare the study received no funding.
Conflict of interest
The authors declare that there is no conflict of interest.
References
- van den Berghe G, Wouters P, Weekers F, et al. Intensive insulin therapy in critically ill patients. N Engl J Med. 2001;345:1359-67. https://doi.org/10.1056/NEJMoa011300
- Corstjens AM, van der Horst ICC, Zijlstra JG, et al. Hyperglycaemia in critically ill patients: marker or mediator of mortality? Crit Care. 2006;10:216. https://doi.org/10.1186/cc4957
- Krinsley JS. Association between hyperglycemia and increased hospital mortality in a heterogeneous population of critically ill patients. Mayo Clin Proc. 2003;78:1471-78. https://doi.org/10.4065/78.12.1471
- Honiden S, Inzucchi SE. Metabolic management during critical illness: glycemic control in the ICU. Semin Respir Crit Care Med. 2015;36:859-69. https://doi.org/10.1055/s-0035-1565253
- Egi M, Bellomo R, Stachowski E, et al. Hypoglycemia and outcome in critically ill patients. Mayo Clin Proc. 2010;85:217-24. https://doi.org/10.4065/mcp.2009.0394
- American Diabetes Association. 6. Glycemic targets: standards of medical care in diabetes-2018. Diabetes Care. 2018;41:55-64. https://doi.org/10.2337/dc18-S006
- Jacobi J, Bircher N, Krinsley J, et al. Guidelines for the use of an insulin infusion for the management of hyperglycemia in critically ill patients. Crit Care Med. 2012;40:3251-76. https://doi.org/10.1097/CCM.0b013e3182653269
- Marik PE, Bellomo R. Stress hyperglycemia: an essential survival response! Crit Care Med. 2013;41:e93-4. https://doi.org/10.1097/CCM.0b013e318283d124
- Hsu CW, Sun SF, Lin HS. Glycemic variability in critically ill patients: risk factors and association with mortality. Chin Med J (Engl). 2020;133:1255-56. https://doi.org/10.1097/CM9.0000000000000686
- Chao WC, Tseng CH, Wu CL, Shih SJ, Yi CY, Chan MC. Higher glycemic variability within the first day of ICU admission is associated with increased 30-day mortality in ICU patients with sepsis. Ann Intensive Care. 2020;10:17. https://doi.org/10.1186/s13613-020-0635-3
- Fuentes B, Pastor-Yborra S, Gutiérrez-Zúñiga R, et al. Glycemic variability: prognostic impact on acute ischemic stroke and the impact of corrective treatment for hyperglycemia. The GLIAS-III translational study. J Transl Med. 2020;18:414. https://doi.org/10.1186/s12967-020-02586-4
- Knaus WA, Draper EA, Wagner DP, Zimmerman JE. APACHE II: a severity of disease classification system. Crit Care Med. 1985;13:818-29.
- Vincent JL, Moreno R, Takala J, et al. The SOFA (Sepsis-related Organ Failure Assessment) score to describe organ dysfunction/failure. On behalf of the working group on sepsis-related problems of the European Society of Intensive Care Medicine. Intensive Care Med. 1996;22:707-10. https://doi.org/10.1007/BF01709751
- Service FJ, Molnar GD, Rosevear JW, Ackerman E, Gatewood LC, Taylor WF. Mean amplitude of glycemic excursions, a measure of diabetic instability. Diabetes. 1970;19:644-55. https://doi.org/10.2337/diab.19.9.644
- NICE-SUGAR Study Investigators; Finfer S, Chittock DR, et al. Intensive versus conventional glucose control in critically ill patients. N Engl J Med. 2009;360:1283-97. https://doi.org/10.1056/NEJMoa0810625
- Hoang QN, Pisani MA, Inzucchi S, Hu B, Honiden S. The prevalence of undiagnosed diabetes mellitus and the association of baseline glycemic control on mortality in the intensive care unit: a prospective observational study. J Crit Care. 2014;29:1052-56. https://doi.org/10.1016/j.jcrc.2014.06.007
- Lanspa MJ, Hirshberg EL, Phillips GD, Holmen J, Stoddard G, Orme J. Moderate glucose control is associated with increased mortality compared with tight glucose control in critically ill patients without diabetes. Chest. 2013;143:1226-34. https://doi.org/10.1378/chest.12-2072
- Donati A, Damiani E, Domizi R, et al. Glycaemic variability, infections and mortality in a medical-surgical intensive care unit. Crit Care Resusc. 2014;16:13-23.
- Eslami S, Taherzadeh Z, Schultz MJ, Abu-Hanna A. Glucose variability measures and their effect on mortality: a systematic review. Intensive Care Med. 2011;37:583-93. https://doi.org/10.1007/s00134-010-2129-5
- Krinsley JS. Glycemic variability: a strong independent predictor of mortality in critically ill patients. Crit Care Med. 2008;36:3008-13. https://doi.org/10.1097/CCM.0b013e31818b38d2
- Wintergerst KA, Buckingham B, Gandrud L, Wong BJ, Kache S, Wilson DM. Association of hypoglycemia, hyperglycemia, and glucose variability with morbidity and death in the pediatric intensive care unit. Pediatrics. 2006;118:173-79. https://doi.org/10.1542/peds.2005-1819
- Monnier L, Mas E, Ginet C, et al. Activation of oxidative stress by acute glucose fluctuations compared with sustained chronic hyperglycemia in patients with type 2 diabetes. JAMA. 2006;295:1681-87. https://doi.org/10.1001/jama.295.14.1681
- Brownlee M. The pathobiology of diabetic complications: a unifying mechanism. Diabetes. 2005;54:1615-25. https://doi.org/10.2337/diabetes.54.6.1615
- Gómez AM, Muñoz OM, Marin A, et al. Different indexes of glycemic variability as identifiers of patients with risk of hypoglycemia in type 2 diabetes mellitus. J Diabetes Sci Technol. 2018;12:1007-15. https://doi.org/10.1177/1932296818758105
- Hryciw BN, Ghossein J, Rochwerg B, et al. Glycemic variability as a prognostic factor for mortality in patients with critical illness: a systematic review and meta-analysis. Crit Care Explor. 2024;6:e1025. https://doi.org/10.1097/CCE.0000000000001025
- Krinsley JS. Glycemic variability and mortality in critically ill patients: the impact of diabetes. J Diabetes Sci Technol. 2009;3:1292-301. https://doi.org/10.1177/193229680900300609
Copyright and license
Copyright © 2025 The Author(s). This is an open access article distributed under the Creative Commons Attribution License (CC BY), which permits unrestricted use, distribution, and reproduction in any medium or format, provided the original work is properly cited.