Abstract
Background: Subarachnoid hemorrhage (SAH) is a life-threatening cerebrovascular event with high morbidity and mortality. Early brain edema is a key determinant of prognosis and can be quantified using the Subarachnoid Hemorrhage Early Brain Edema Score (SEBES). Although SEBES has demonstrated prognostic value in spontaneous SAH, its utility in traumatic SAH remains underexplored. This study aimed to evaluate the relationship between SEBES and clinical outcomes in both traumatic and non-traumatic SAH patients.
Methods: In this retrospective cohort study, 50 SAH patients (30 traumatic, 20 non-traumatic) admitted to the intensive care unit (ICU) between January 2023 and May 2024 were analyzed. SEBES scores were calculated from brain CT scans obtained within 24 hours of SAH onset. Patients were classified by etiology and SEBES grade (≤2 vs. >2). Demographic data, clinical scores, laboratory parameters, and mortality at 1 and 3 months were compared. A subgroup analysis was performed to assess SEBES-associated outcomes within each SAH etiology.
Results: SEBES scores were markedly higher in non-traumatic SAH patients. Higher SEBES (>2) was associated with lower admission and discharge neurological scores (GCS, FOUR), longer ICU and ventilator duration, and higher 1- and 3-month mortality (all p < 0.05). Subgroup analysis revealed that the negative prognostic impact of elevated SEBES was evident in both traumatic and non-traumatic SAH groups, particularly regarding mortality and ICU burden.
Conclusion: SEBES is a valuable and simple radiological prognostic tool applicable to both traumatic and non-traumatic SAH. A SEBES score >2 may predict worse neurological outcomes, higher mortality, and increased ICU resource utilization. Its early application may aid in risk stratification and critical care planning.
Keywords: subarachnoid hemorrhage, early brain edema score, prognosis, SEBES, traumatic SAH, non-traumatic SAH, neurocritical care
Introduction
Subarachnoid hemorrhage (SAH) is a severe cerebrovascular condition that accounts for approximately 5% of all strokes and is associated with high rates of mortality and morbidity. The majority of SAH cases result from trauma, while in 80–85% of non-traumatic cases, aneurysmal rupture is identified as the underlying cause (1). SAH patients frequently require intensive care and constitute a significant proportion of the patient population in intensive care units (ICUs). Common complications occurring within the first 72 hours after SAH include early brain injury, early brain edema, and symptomatic vasospasm (2). Intracranial edema increases intracranial pressure, further impairing cerebral perfusion and increasing the risk of neuronal ischemia, ultimately leading to poor neurological outcomes.
Early brain edema refers to the immediate pathophysiological processes that occur following aneurysmal rupture. The extravasation of blood into the subarachnoid space leads to increased intracranial pressure, followed by a reduction in cerebral perfusion pressure, disruption of cerebral autoregulation, and transient or permanent ischemia (3,4,5). The persistence of brain edema after aneurysmal SAH, also referred to as persistent edema (PE), is considered an indicator of early brain injury (EBI) (6).
The Subarachnoid Hemorrhage Early Brain Edema Score (SEBES) is a radiographic assessment tool used to evaluate early brain edema in patients with spontaneous SAH (3,7). Studies have demonstrated that patients with high SEBES scores have an increased likelihood of delayed cerebral ischemia and poor clinical outcomes. Furthermore, SEBES has been shown to be a stronger prognostic indicator compared to other scoring systems (3,5). The SEBES system has been proposed as a reliable prognostic factor for both clinical outcomes and mortality in spontaneous SAH patients (1,3,7). Early application of SEBES may be beneficial in identifying high-risk patients and optimizing treatment strategies accordingly (7).
This study aimed to evaluate all SAH patients (both traumatic and non-traumatic) admitted to the ICU using the SEBES scoring system to predict those at risk of poor neurological outcomes. Additionally, we aim to investigate the prognostic relationship between SEBES and traumatic SAH in comparison with other commonly used scoring methods.
Materials and Methods
Ethical approval
This study was conducted in accordance with the ethical principles of the Declaration of Helsinki and was approved by the Institutional Review Board of the Local University (Decision No: 1670 / 03.07.2024). Due to its retrospective design and the use of anonymized clinical data, the requirement for written informed consent was waived by the ethics committee.
Study population
This study included all patients over the age of 18 who were diagnosed with subarachnoid hemorrhage (SAH), regardless of etiology, and were monitored and treated in the general intensive care unit (ICU) of our hospital between January 2023 and May 2024. The study was designed as a retrospective observational cohort study.
Inclusion criteria: Patients who underwent brain computed tomography (CT) within the first 24 hours after SAH onset, had a brain CT angiography performed for the detection of aneurysms or other vascular anomalies, and were assessed using all scoring systems specified in our study were included. Additionally, patients with follow-up data available for the first and third months were included in the study.
Exclusion criteria: Patients with multiorgan failure, multiple trauma, pregnancy, sepsis, or severe infections, as well as those with concurrent subdural and/or epidural hematomas or ischemic stroke at the time of SAH diagnosis, and patients with perimesencephalic subarachnoid hemorrhage were also excluded.
A total of 50 patients who met the specified criteria were included in the study. Among them, 20 had non-traumatic SAH (aneurysm detected in 9 patients, spontaneous SAH in 8 patients, and hypertension-related SAH in 3 patients), while 30 had traumatic SAH.
Patients were divided into two groups: non-traumatic SAH and traumatic SAH, and statistical comparisons were made. Additionally, patients were classified into two subgroups based on SEBES scores: those with SEBES >2 and those with SEBES ≤2, and their prognosis and other clinical parameters were compared.
Scoring systems
The following scoring systems were recorded for all patients at the time of ICU admission and discharge using hospital records and patient files: Glasgow Coma Scale (GCS), Full Outline of UnResponsiveness (FOUR), modified Fisher scale, World Federation of Neurosurgical Societies (WFNS) scale, Hunt and Hess scale, and modified Rankin Scale (mRS). The SEBES was calculated by the investigators. Radiological imaging of the patients was evaluated according to the recommended two-section method for SEBES assessment. The SEBES score ranged from 0 to 4, with 4 indicating the most severe condition.
Laboratory tests
Following an 8-hour fasting period, 5 mL of venous blood was drawn from the antecubital fossa for complete blood count (hemoglobin, hematocrit, leukocytes, lymphocytes, neutrophils, platelets). Routine biochemical blood tests (glucose, urea, creatinine, albumin), C-reactive protein (CRP), and procalcitonin levels were also measured. In addition, sodium levels were recorded on days 1, 3, and 7.
Statistical analysis
All values were expressed as mean ± standard deviation, mean (95% confidence interval), percentage (95% confidence interval), or median (interquartile range). The sample size of our study was determined based on a power analysis with a significance level of α=0.05 and a power (1–β) of 0.95. Differences between groups were analyzed using the Student’s t-test, Mann–Whitney U test, chi-square test, Fisher’s exact test, or analysis of variance (ANOVA). Statistical significance was defined as p < 0.05. Continuous variables were expressed as mean ± standard deviation and compared using the Student’s t-test, assuming approximate normality. Categorical variables were expressed as counts and percentages and compared using the chi-square test. No normality testing was required for categorical data. For all significant parameters, logistic regression analyses were performed. All statistical analyses were conducted using SPSS version 22.0. Multiple comparisons were adjusted using the Holm–Bonferroni correction.
Results
In the non-traumatic SAH group (n=20), the mean age was 60.25 ±, whereas in the traumatic SAH group (n=30), it was 51.03 ±. In the non-traumatic group, 14 patients were male, while in the traumatic group, 27 patients were male. There was no statistically significant difference between the groups in terms of age and gender (p>0.05).
Among vascular risk factors, hypertension (HT) was more prevalent in the non-traumatic SAH group, showing borderline statistical significance (p=0.05). Other risk factors, including diabetes mellitus (DM), previous cerebrovascular disease (CVD), and coronary artery disease (CAD), did not show statistically significant differences between the groups.
The mortality rate at the first month was similar between the groups. However, by the third month, the mortality rate was higher in the non-traumatic group, though this difference was not statistically significant (p=0.07). The data presented above are summarized in Table 1.
| HT: Hypertension, DM: Diabetes Mellitus, CVD: Cerebrovascular Disease, CAD: Coronary Artery Disease. | |||
| Table 1. Comparison of demographic characteristics, vascular risk factors, and clinical outcome between non-traumatic and traumatic SAH groups | |||
| Variable |
|
|
|
| Age (years) |
|
|
|
| Gender (Male, n) |
|
|
|
| HT (n) |
|
|
|
| DM (n) |
|
|
|
| CVD (n) |
|
|
|
| CAD (n) |
|
|
|
| 1st-Month Mortality (n) |
|
|
|
| 3rd-Month Mortality (n) |
|
|
|
When the groups were compared based on scoring systems, the SEBES score was markedly higher in the non-traumatic SAH group (p = 0.00). Although the FOUR scores at ICU admission were higher in the traumatic SAH group, the difference between the groups was not statistically significant (p = 0.07).
Additionally, no statistically significant differences were observed between the groups in terms of GCS, mRS, modified Fisher scale, WFNS, and Hunt-Hess scores at admission. Similarly, ICU length of stay and ventilator support duration did not differ markedly between the two groups. However, at discharge, the GCS and FOUR scores were markedly higher in the traumatic SAH group (p=0.03), whereas the mRS score was higher in the non-traumatic SAH group (p=0.03). These comparisons are summarized in Table 2.
| GCS: Glasgow Coma Scale, FOUR: Full Outline of UnResponsiveness, WFNS: World Federation of Neurosurgical Societies, mRS: Modified Rankin Scale, mFISHER: Modified Fisher Scale. | |||
| Table 2. Comparison of admission and discharge clinical scores, ICU length of stay, and duration of ventilator support between non-traumatic and traumatic SAH groups | |||
| Variable |
|
|
|
| Admission GCS |
|
|
|
| Admission FOUR |
|
|
|
| Admission mFISHER |
|
|
|
| Admission mRS |
|
|
|
| Admission WFNS |
|
|
|
| Admission Hunt-Hess |
|
|
|
| SEBES |
|
|
|
| ICU Length of Stay (days) |
|
|
|
| Ventilator Support Duration (days) |
|
|
|
| Discharge GCS |
|
|
|
| Discharge FOUR |
|
|
|
| Discharge mRS |
|
|
|
No statistically significant differences were found between the traumatic and non-traumatic SAH groups regarding laboratory test results. The mean values and corresponding p-values for each parameter are presented in Table 3.
| Table 3. Comparison of admission and follow-up laboratory findings between non-traumatic and traumatic SAH groups | |||
| Laboratory Parameter |
|
|
|
| Albumin (g/L) |
|
|
|
| Creatinine (mg/dL) |
|
|
|
| Hemoglobin (g/dL) |
|
|
|
| Platelet Count (10^9/L) |
|
|
|
| Leukocyte Count (10^9/L) |
|
|
|
| Neutrophil (%) |
|
|
|
| Lymphocyte (%) |
|
|
|
| Neutrophil/Lymphocyte Ratio |
|
|
|
| C-Reactive Protein (CRP, mg/L) |
|
|
|
| Procalcitonin (ng/mL) |
|
|
|
| Admission Sodium (mmol/L) |
|
|
|
| Day 3 Sodium (mmol/L) |
|
|
|
| Day 7 Sodium (mmol/L) |
|
|
|
When patients were categorized based on SEBES scores, in the non-traumatic SAH group, 13 patients had a high SEBES score (SEBES >2), while 7 patients had a low SEBES score (SEBES ≤2). In the traumatic SAH group, 10 patients had a high SEBES score, whereas 20 patients had a low SEBES score.
Overall, 23 patients had high SEBES scores, while 27 had low SEBES scores. A comparison of these groups based on demographic characteristics, vascular risk factors, and prognosis is summarized in Table 4. Among patients with low SEBES scores, none had a history of diabetes mellitus (DM), whereas 6 patients in the high SEBES group had DM, a difference that was statistically significant (p = 0.01). Furthermore, non-traumatic SAH was markedly more prevalent in the high SEBES group (p = 0.03). Mortality rates at both one and three months were also markedly higher in the SEBES >2 group.
| HT: Hypertension, DM: Diabetes mellitus, CVD: Cerebrovascular disease, CAD: Coronary artery disease. | |||
| Table 4. Comparison of demographic characteristics, vascular risk factors, and mortality outcomes between patients with higher (SEBES >2) and lower (SEBES ≤2) subarachnoid early brain edema scores | |||
| Variables |
|
|
|
| Age (years) |
|
|
|
| Gender (Male, n) |
|
|
|
| HT (n) |
|
|
|
| DM (n) |
|
|
|
| Previous CVD (n) |
|
|
|
| CAD (n) |
|
|
|
| Spontaneous SAH (n) |
|
|
|
| 1st-Month Mortality (n) |
|
|
|
| 3rd-Month Mortality (n) |
|
|
|
The groups were also compared based on their scoring systems, with the results summarized in Table 5. In the SEBES >2 group, admission GCS and FOUR scores were markedly lower compared to the SEBES ≤2 group (p = 0.00). Conversely, m FISHER, WFNS, Hunt-Hess, and mRS scores were markedly higher in the SEBES >2 group (p = 0.00).
| GCS: Glasgow Coma Scale, FOUR: Full outline of UnResponsiveness, WFNS: World Federation of Neurosurgical Societies, mRS: Modified Rankin Scale, mFISHER: Modified Fisher Scale. | |||
| Table 5. Comparison of admission and discharge clinical scores, ICU length of stay, and duration of ventilator support between patients with higher (SEBES >2) and lower (SEBES ≤2) subarachnoid early brain edema scores | |||
| Variables |
|
|
|
| Admission GCS |
|
|
|
| Admission FOUR |
|
|
|
| Admission FISHER |
|
|
|
| Admission mRS |
|
|
|
| Admission WFNS |
|
|
|
| Admission Hunt-Hess |
|
|
|
| ICU Length of Stay (days) |
|
|
|
| Ventilator Support Duration (days) |
|
|
|
| Discharge GCS |
|
|
|
| Discharge FOUR |
|
|
|
| Discharge mRS |
|
|
|
Regarding prognosis, discharge GCS and FOUR scores were lower in the SEBES >2 group, whereas the mRS score was higher (p = 0.00). Additionally, 1st-month and 3rd-month mortality rates were markedly higher in the SEBES >2 group compared to the SEBES ≤2 group (p = 0.03 and p<0.001, respectively). Furthermore, the duration of ventilator support in the ICU was markedly longer in the high SEBES group (p = 0.01).
Laboratory test results of the patients were compared. No significant difference was found between the groups in terms of admission sodium levels. However, serum sodium levels on days 3 and 7 were markedly higher in the SEBES >2 group (p<0.001). No other statistically significant differences were observed in the remaining laboratory parameters. The laboratory test values and corresponding p-values are presented in Table 6.
| Table 6. Comparison of admission and follow-up laboratory findings between patients with higher (SEBES >2) and lower (SEBES ≤2) subarachnoid early brain edema scores | |||
| Laboratory Parameter |
|
|
|
| Albumin (g/L) |
|
|
|
| Creatinine (mg/dL) |
|
|
|
| Hemoglobin (g/dL) |
|
|
|
| Platelet Count (10^9/L) |
|
|
|
| Leukocyte Count (10^9/L) |
|
|
|
| Neutrophil (%) |
|
|
|
| Lymphocyte (%) |
|
|
|
| Neutrophil/Lymphocyte Ratio |
|
|
|
| C-Reactive Protein (CRP, mg/L) |
|
|
|
| Procalcitonin (ng/mL) |
|
|
|
| Admission Sodium (mmol/L) |
|
|
|
| Day 3 Sodium (mmol/L) |
|
|
|
| Day 7 Sodium (mmol/L) |
|
|
|
Multivariable logistic regression analysis for 3-month mortality showed that age demonstrated a trend toward higher risk (OR 0.75, 95% CI 0.55–1.01, p=0.057). None of the other variables, including gender, hypertension, subarachnoid hemorrhage type, SEBES score, GCS, Fisher score, ICU length of stay, or ventilator support duration, were significantly associated with mortality. Some variables showed very wide confidence intervals, reflecting limited event numbers or variable distribution, and should be interpreted with caution (Table 7).
| Table 7. Multivariable logistic regression analysis for 3-month mortality | ||||||
| Variable |
|
|
|
|
|
|
| Age |
|
|
|
|
|
|
| Gender |
|
|
|
|
|
|
| Hypertension (HT) |
|
|
|
|
|
|
| Subarachnoid Hemorrhage (SAH) |
|
|
|
|
|
|
| SEBES |
|
|
|
|
|
|
| GCS |
|
|
|
|
|
|
| Fisher Score |
|
|
|
|
|
|
| ICU Length of Stay (days) |
|
|
|
|
|
|
| Ventilator Support Duration (days) |
|
|
|
|
|
|
Figure 1 illustrates the Exp(B) values and their 95% confidence intervals for each variable included in the regression analysis. A logarithmic scale was used to better visualize the large differences in Exp(B) values. The red dashed line represents the point of no effect (Exp(B) = 1); variables with values below this line indicate a negative association, while those above the line suggest a positive association.
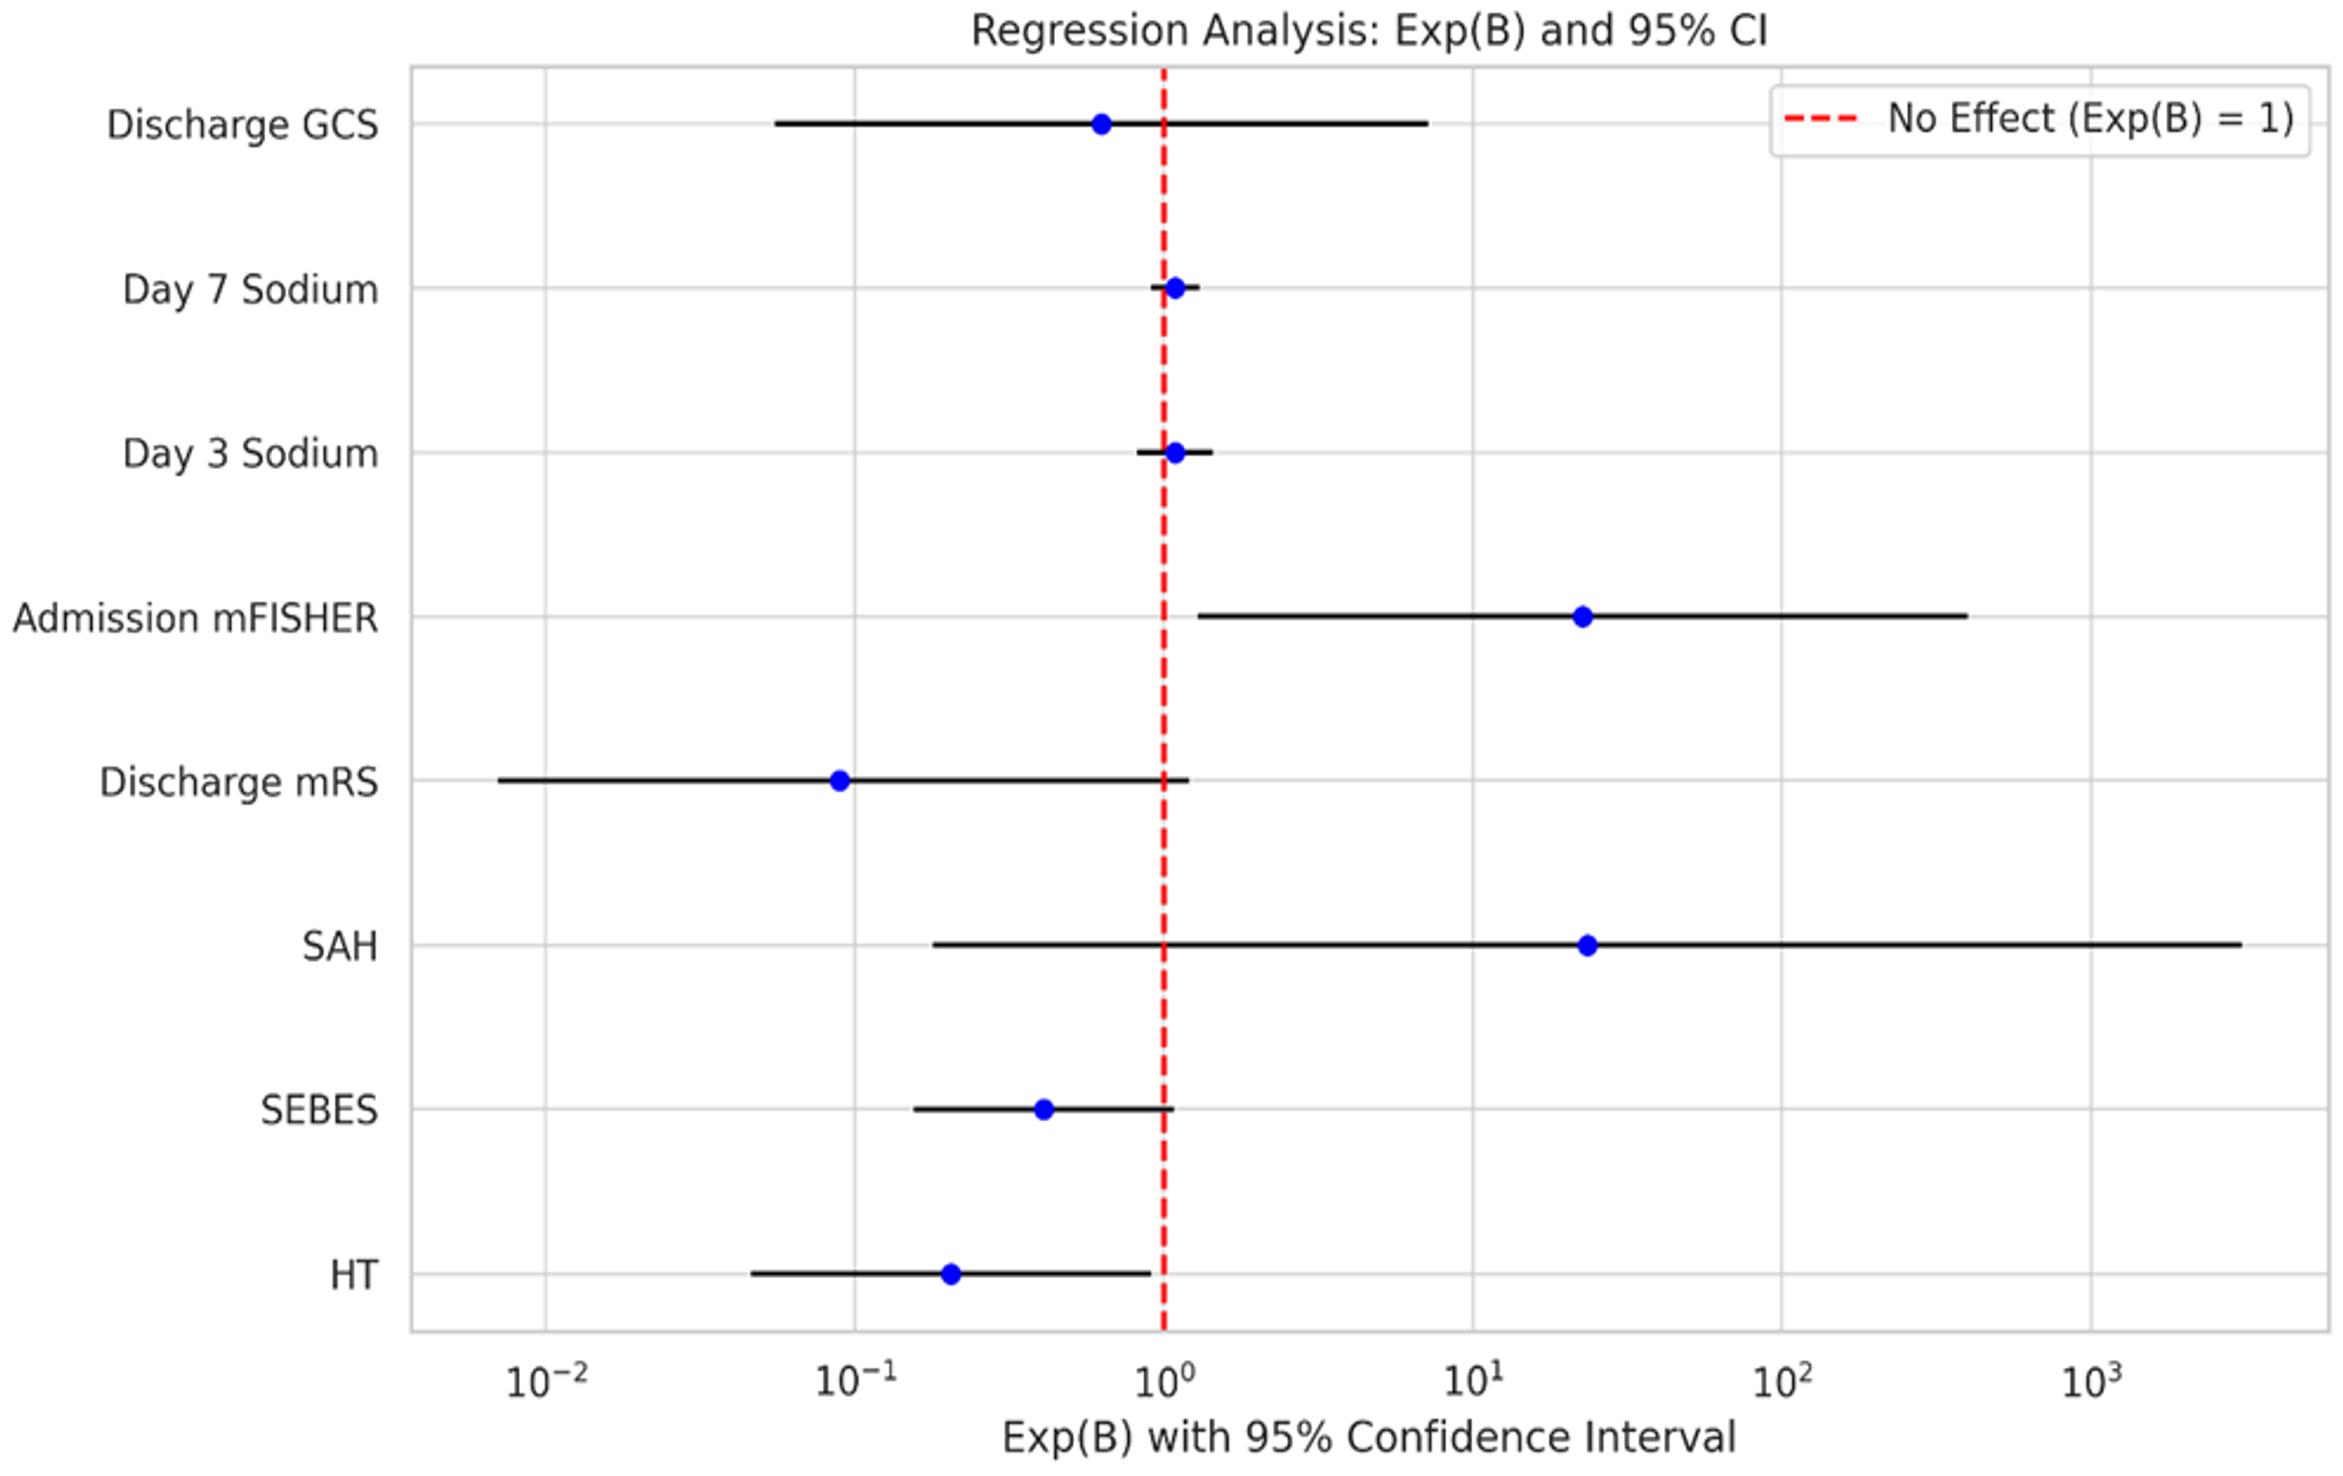
To account for multiple testing, the Holm–Bonferroni correction was applied. After adjustment, only SEBES remained significantly different between groups in Table 2. In Table 4, 1- and 3-month mortality continued to show significant associations, whereas other variables lost significance. In Table 5, all admission and discharge clinical severity scores retained their significance after correction, while ventilator support duration did not. In Table 6, only Day 3 and Day 7 sodium levels remained significantly different between SEBES groups following adjustment.
Discussion
Predicting the prognosis of patients with SAH remains a fundamental yet challenging aspect of clinical neurocritical care. Accurate and early prediction allows clinicians to tailor interventions, monitor complications effectively, and improve overall patient outcomes. Despite the existence of various clinical and radiological scoring systems, a universally accepted, highly predictive tool remains elusive (8,9). Among the established prognostic indicators, cerebral edema and initial neurological status stand out for their strong correlation with delayed cerebral ischemia and infarcts (7). EBI, encompassing the cascade of pathophysiological changes occurring immediately after aneurysmal rupture, including increased intracranial pressure (ICP), disruption of cerebral autoregulation, and ischemia—has gained prominence as a critical determinant of outcome (2,4).
The SEBES has emerged as a simple, reproducible radiological tool designed to assess early brain edema severity on initial CT imaging in spontaneous SAH patients (3,7). This scoring system evaluates two predefined CT slices for evidence of cerebral edema, producing an objective numerical value indicative of brain injury severity. While initially validated in aneurysmal SAH, recent studies have suggested SEBES’s applicability in non-aneurysmal and even traumatic SAH populations (1,8). Our study uniquely applies the original SEBES system across both traumatic and non-traumatic SAH cases, confirming its prognostic utility beyond its initial scope.
Our analysis revealed that non-traumatic SAH patients had markedly higher early SEBES scores compared to their traumatic counterparts, with a notable prevalence of hypertension in this group (p=0.05). This finding aligns with previous research emphasizing hypertension as a risk factor for worse outcomes in non-traumatic SAH (10). The non-traumatic group also demonstrated worse discharge neurological status (p=0.03) and markedly higher mortality rates at one and three months (p<0.001). These observations corroborate the prognostic significance of early brain edema quantified by SEBES, mirroring results from Ahn et al. and Said et al., who linked elevated SEBES with increased risk of delayed cerebral ischemia and unfavorable clinical outcomes (3,7).
In addition to mortality, our data highlighted that patients with SEBES scores greater than 2 experienced prolonged mechanical ventilation and longer ICU stays, indicating more severe systemic and neurological compromise. This trend underscores SEBES’s role not only as a static prognostic marker but also as a dynamic indicator of disease severity influencing critical care resource utilization. Previous investigations, including those by Duan et al., have emphasized the utility of SEBES in guiding aggressive interventions such as decompressive craniectomy in poor-grade aneurysmal SAH, further supporting its clinical relevance (11).
Age-stratified analyses reinforce the higher prognostic accuracy of SEBES in patients under 60 years old, consistent with Eibach et al.’s findings that younger patients exhibit a stronger association between brain edema severity and outcome (12). This phenomenon may reflect age-dependent differences in cerebral plasticity and resilience, suggesting that SEBES could be particularly valuable in predicting outcomes among younger SAH populations.
Regarding the temporal profile of cerebral edema, our findings align with the limited but growing body of literature indicating edema resolution occurs around one week post-ictus (5,13). Patients with persistently high SEBES scores also exhibited markedly elevated serum sodium levels on days 3 and 7 (p<0.001), paralleling previous reports that hypernatremia serves as an early biochemical predictor of delayed cerebral edema and correlates with increased mortality (5,10,14). The mechanisms underlying hypernatremia post-SAH may involve osmotherapy administration, central diabetes insipidus, or disruption of sodium regulation due to hypothalamic injury (5). These findings highlight the importance of integrating biochemical markers with radiological scores to better predict patient trajectories and potentially guide tailored interventions.
From a practical standpoint, the ease of SEBES application using routine CT scans makes it a promising tool for widespread clinical adoption. Early identification of patients with severe brain edema could inform decisions regarding intensive monitoring modalities such as intracranial pressure measurement, cerebral oxygenation monitoring, or early consideration of surgical decompression (11). Additionally, consistent use of SEBES could improve interprofessional communication and standardize care protocols across neurocritical units, addressing a notable gap identified in prior SAH management guidelines (7,8).
This study has several limitations. Its retrospective design and small sample size limit the strength and generalizability of the results. The lack of serial imaging data prevented us from evaluating temporal resolution or progression of cerebral edema or to examine its relationship with delayed infarction and large-scale edema. These issues should be addressed in future prospective studies (13). Another limitation is not to include inflammatory markers and detailed hemodynamic vaiables, may have restricted the scope of prognostic modeling (2,6).
Despite these limitations, our logistic regression analysis confirms that SEBES> 2 is associated with poor outcomes in both traumatic and non-traumatic SAH. To our knowledge, this is among the first studies to extend the application of SEBES to traumatic SAH, supporting its broader prognostic utility. Nonetheless, before widespread routine use, further validation through large-scale, multicenter prospective trials is warranted to refine cutoff values and adapt the scoring system for diverse SAH populations.
In conclusion, the SEBES scoring system is a valuable radiographic marker that correlates with mortality, neurological deterioration, and ICU burden in SAH patients. A score >2 is consistently associated with worse outcomes, regardless of etiology. These findings support the integration of SEBES into early neurocritical care decision-making. Future prospective multicenter studies with larger cohorts and longitudinal imaging follow-up are warranted to validate these findings and refine SEBES-based prognostic models.
Ethical approval
This study has been approved by the T.C. İzmir Bakirçay University Non-Interventional Clinical Research Ethics Committee (approval date: 03.07.2024, number: 1670). Written informed consent was obtained from the participants.
Author contribution
Study conception and design: AÇ, YA; data collection: SN, AÇ, AEÖ, İD; analysis and interpretation of results: YA, NŞ; draft manuscript preparation: YA, AÇ. The author(s) reviewed the results and approved the final version of the article.
Source of funding
The authors declare the study received no funding.
Conflict of interest
The authors declare that there is no conflict of interest.
References
- Zhang A, Zhang Z, Zhang WB, et al. Development of a nomogram for predicting clinical outcome in patients with angiogram-negative subarachnoid hemorrhage. CNS Neurosci Ther. 2021;27:1339-47. https://doi.org/10.1111/cns.13712
- Savarraj J, Parsha K, Hergenroeder G, et al. Early brain injury associated with systemic inflammation after subarachnoid hemorrhage. Neurocrit Care. 2018;28:203-11. https://doi.org/10.1007/s12028-017-0471-y
- Ahn SH, Savarraj JP, Pervez M, et al. The Subarachnoid hemorrhage early brain edema score predicts delayed cerebral ischemia and clinical outcomes. Neurosurgery. 2018;83:137-45. https://doi.org/10.1093/neuros/nyx364
- Rass V, Helbok R. Early brain injury after poor-grade subarachnoid hemorrhage. Curr Neurol Neurosci Rep. 2019;19:78. https://doi.org/10.1007/s11910-019-0990-3
- Rass V, Ianosi BA, Wegmann A, et al. Delayed resolution of cerebral edema is associated with poor outcome after nontraumatic subarachnoid hemorrhage. Stroke. 2019;50:828-36. https://doi.org/10.1161/STROKEAHA.118.024283
- Ahn SH, Burkett A, Paz A, et al. Systemic inflammatory markers of persistent cerebral edema after aneurysmal subarachnoid hemorrhage. J Neuroinflammation. 2022;19:199. https://doi.org/10.1186/s12974-022-02564-1
- Said M, Gümüs M, Herten A, et al. Subarachnoid Hemorrhage Early Brain Edema Score (SEBES) as a radiographic marker of clinically relevant intracranial hypertension and unfavorable outcome after subarachnoid hemorrhage. Eur J Neurol. 2021;28:4051-9. https://doi.org/10.1111/ene.15033
- Said M, Odensass S, Gümüs M, et al. Comparing radiographic scores for prediction of complications and outcome of aneurysmal subarachnoid hemorrhage: which performs best? Eur J Neurol. 2023;30:659-70. https://doi.org/10.1111/ene.15634
- Fang YJ, Mei SH, Lu JN, et al. New risk score of the early period after spontaneous subarachnoid hemorrhage: for the prediction of delayed cerebral ischemia. CNS Neurosci Ther. 2019;25:1173-81. https://doi.org/10.1111/cns.13202
- Lantigua H, Ortega-Gutierrez S, Schmidt JM, et al. Subarachnoid hemorrhage: who dies, and why? Crit Care. 2015;19:309. https://doi.org/10.1186/s13054-015-1036-0
- Duan YH, He J, Liu XF, et al. Role of the subarachnoid hemorrhage early brain edema score in the management of decompressive craniectomy for poor-grade aneurysmal subarachnoid hemorrhage. World Neurosurg. 2022;166:e245-52. https://doi.org/10.1016/j.wneu.2022.06.147
- Eibach M, Won SY, Bruder M, et al. Age dependency and modification of the Subarachnoid Hemorrhage Early Brain Edema Score. J Neurosurg. 2020;134:946-52. https://doi.org/10.3171/2019.12.JNS192744
- Torné R, Hoyos J, Llull L, et al. Edema resolution and clinical assessment in poor-grade subarachnoid hemorrhage: useful indicators to predict delayed cerebral infarctions? J Clin Med. 2021;10:321. https://doi.org/10.3390/jcm10020321
- Qureshi AI, Suri MF, Sung GY, et al. Prognostic significance of hypernatremia and hyponatremia among patients with aneurysmal subarachnoid hemorrhage. Neurosurgery. 2002;50:749-56. https://doi.org/10.1097/00006123-200204000-00012
Copyright and license
Copyright © 2026 The Author(s). This is an open access article distributed under the Creative Commons Attribution License (CC BY), which permits unrestricted use, distribution, and reproduction in any medium or format, provided the original work is properly cited.