Abstract
Objective: This study evaluates the diagnostic performance of renal resistive index (RRI) and urinary cell cycle arrest biomarkers for early detection of sepsis-induced acute kidney injury (AKI) in a rat model using cecal ligation and puncture (CLP).
Materials and Methods: Sixty female Wistar Albino rats were allocated into six groups (n=10): five CLP groups based on measurement timing (3, 6, 12, 24, and 48 hours post-procedure) and one sham group. Following CLP, RRI measurements were performed, and blood, urine, and tissue samples were collected before sacrifice. Urinary tissue inhibitor of metalloproteinase-2 (TIMP-2) and insulin-like growth factor binding protein-7 (IGFBP-7) were quantified via enzyme-linked immunosorbent assay (ELISA). Serum creatinine and lactate levels were measured, and histopathological kidney examination was conducted.
Results: RRI increased significantly at six hours (0.44±0.04), peaking at 24 hours (0.73±0.02) post-CLP. The [TIMP-2×IGFBP-7] combination elevated significantly at three hours (P<0.05) versus sham, reaching maximum levels at 48 hours. Strong positive correlations existed between histopathological injury severity and IGFBP-7 (p=0.764), TIMP-2 (p=0.779), [TIMP-2×IGFBP-7] (p=0.785), and RRI (p=0.837) (all P<0.0001). For predicting grade ≥3 tubular injury (>25% damage), cell cycle arrest biomarkers outperformed serum creatinine and lactate. RRI >0.45 demonstrated optimal diagnostic accuracy (sensitivity 89%, specificity 87%).
Conclusions: In this CLP-induced polymicrobial sepsis model, both RRI and urinary cell cycle arrest biomarkers predicted early AKI within similar timeframes, with RRI >0.45 showing superior predictive value.
Keywords: sepsis, acute kidney injury, cell cycle arrest biomarkers, renal resistive index, animal model
Introduction
Sepsis is life-threatening clinical syndrome characterized by organ dysfunction that is caused by the host’s exaggerated immune response to an infection (1). Acute kidney injury (AKI), one of the most common organ dysfunctions caused by sepsis, occurs in approximately 40–50% of septic patients, resulting in a 6–8-fold increase in mortality (2).
Sepsis induced-AKI (SI-AKI) differs from other etiologies in terms of its pathophysiological basis (2,3,4). The changes in kidney function occurring in the early periods of SI-AKI can be regarded as clinical and biochemical reflections of adaptive responses that arise as a survival response (2). For this reason, renal damage in the early periods of SI-AKI is functional rather than structural (2). The early detection of such damage and taking the necessary precautions may reverse this damage before structural alterations can occur. Increased serum creatinine, which is in common use today in the diagnosis and classification of AKI, is affected by various extrarenal factors such as body weight, race, gender, body fluid volume, several medications, muscle metabolism and protein intake, and serves as a weak biomarker, sometimes causing a delay of 48–72 hours in the identification of an impairment in kidney function (5). Various biomarkers released from the kidney into the blood and urine after a kidney injury may define AKI in an early period before an increase in serum creatinine is observed. Although more than 20 biomarkers have been described to date for the early diagnosis of AKI, none can be defined as the optimum approach (6,7).
The tissue inhibitor of metalloproteinase-2 (TIMP-2) and the insulin-like growth factor binding protein-7 (IGFBP-7) are promising stress biomarkers in the early detection of AKI that have been introduced in recent years, and may appear 24–48 hours earlier than an increase in serum creatinine, with values that can be measured in the urine (8). Previous studies involving intensive care unit patients have reported that a combined analysis of [TIMP-2]-[IGFBP-7] is superior in performance than serum creatinine, urinary and plasma neutrophil gelatinase-associated lipocalin (NGAL), cystatin-C and kidney injury molecule-1 (KIM-1) (6,8,9). Recent studies have validated the measurement of urinary cell-cycle arrest biomarkers (CCAB), particularly for the early diagnosis of postoperative AKI, and there are ongoing studies aimed at making definitive recommendations regarding the use of these molecules in SI-AKI.
The use of Doppler ultrasound (USG) as a screening tool in intensive care units has rapidly become a widespread practice. The lack of additional costs at each use, being non-invasive, the absence of ionizing radiation exposure, and being a dynamic and reproducible method are important factors underlying the increasingly widespread use of ultrasound in intensive care units. Color Doppler USG can non-invasively visualize the effects of vasoconstriction, hypoxia, stress response and hemodynamic changes on the kidney (10,11). Changes in the blood flow in the intrarenal arch and interlobar arteries can be evaluated, while the renal resistive index (RRI) – a sonographic index reflecting the resistance to flow – can be measured by renal Doppler USG. RRI identifies resistance in the kidney vessel, in other words, renal vasoconstriction, which is an important physiopathological change that occurs in the early periods of AKI in patients with sepsis (12). RRI would seem to be a promising parameter in predicting the development and reversal of AKI in critically ill patients, although there have been few studies to date assessing the performance of RRI in predicting SI-AKI (13,14).
The present study compares the performances of RRI and urinary CCAB in the early detection of AKI resulting from sepsis in a rat model of polymicrobial sepsis induced by the cecal ligation and puncture (CLP) method.
Materials and Method
Experimental study
The animals in this study were kept in accordance with the Guide for the Care and Use of Laboratory Animals of the National Institute of Health. The protocol for the model was reviewed and approved by the Necmettin Erbakan University KONÜDAM Experimental Medicine Application and Research Center Directorate Local Ethics Committee on Animal Experiments. Ethics committee meeting dated 18.05.2018 and protocol numbered 2018-18.
Acquired for the study were 60 female Wistar Albino rates aged five months or above, weighing 300–375 gr. The rats were placed in cages in an environment at 22±1°C and 45–55% humidity, with free access to food and water, and were kept on 12 hours dark and 12 hours light cycle. The rats were divided into five groups of 10 rats based on the time between the CLP procedure and the time of measurement (3, 6, 12, 24, and 48 hours), and an additional sham group. All interventional and imaging procedures were performed under Isoflurane while preserving spontaneous respiration, as described earlier (15,16). The CLP method was used to create the sepsis model. For fluid resuscitation, an intravenous cannula was inserted for the administration of fluids at a rate of 10 ml/kg in the first hour, followed by a rate of 5 ml/kg/hr throughout the experiment. No antibiotherapy was administered to avoid interference in the results due to drug-induced kidney injury. A balanced fluid was used for resuscitation.
CLP Sepsis Model: All rats were placed in the supine position on a heated operating table, with the body temperature measured by a rectal probe. The abdomen was shaved while paying attention to avoid skin damage. The area was wiped with a povidone iodine solution twice using an aseptic technique. The abdomen was opened with a 2-cm midline incision, and the cecum was located and explored. The antimesenteric surface of the cecum (comprising 25%) was ligated distal to the ileocecal valve using 3/0 silk sutures and punctured twice with an 18G needle. The cecum was released into the peritoneal cavity after observing fecal discharge, and the abdomen was closed with 3/0 silk sutures in layers using a simple suturing technique.
RRI was measured and blood, urine and tissue samples were collected 3 hours after the CLP procedure in Group 1, at 6 hours in Group 2, at 12 hours in Group 3, at 24 hours in Group 4, and at 48 hours Group 5, and the rats were sacrificed. An intravenous cannula was inserted, and fluid resuscitation was performed in the rats in the sham-operated group, while spontaneous respiration was maintained under isoflurane anesthesia, while no CLP procedure was performed. RRI was measured by Doppler ultrasound at the beginning and end of the procedure. A midline laparotomy incision was made to collect blood, urine and tissue samples, with a 22-Gauge needle used to aspirate urine from the bladder. The left kidneys of the rats in all groups were recovered and placed in pathology specimen containers filled with 4% formaldehyde for histopathological examination. Finally, the procedure was ended after collecting intracardiac blood samples. The rats were sacrificed by cervical dislocation.
The urine samples collected from the bladder were stored at -80°C for the measurement of TIMP-2 and IGFBP-7 using the (ELISA) enzyme-linked immunosorbent assay method. The blood samples were transferred to blood collection tubes for the measurement of serum creatinine, blood gases and lactate levels, and the samples were analyzed immediately.
Ultrasonographic examination
A linear transducer (12 MHz, GE, Logiq e, USA) was used for the sonographic examination, with the “vascular imaging” option preselected. While the experimental animal was in the supine position, the probe was inserted in the transverse plane through the midline to acquire images of the aorta. The platform was then shifted together with the animal to reach the level of the renal artery. The color Doppler mode was used to acquire images of the renal artery and renal vein. The (PW) pulsed-wave mode was used to evaluate blood flow in the renal artery. The indicator line in the PW mode was brought to the renal artery in the flow direction. Typically, three to five arterial signals were acquired from the renal artery. The appearance of the waveform was optimized using the lowest pulse repetition frequency and the highest possible gain. The images of the waveforms indicating the velocity of the flow in the artery at peak systole and diastole were acquired, and RRI was calculated using the following formula:
RRI = (PeakSystolicVelocity – EndDiastolicVelocity) / PeakSystolicVelocity
All sonographic examinations were performed by the same investigator, who had previous experience in the procedure.
Examination of urine serum and tissue samples
Serum lactate levels were measured as part of the blood gases analysis using an ABL800 FLEX© (Radiometer Medical ApS, 2700 Brønshøj, Denmark) analyzer. Urinary IGFBP-7 and TIMP-2 levels were measured using ELISA technique (SinoGeneClon Biotech Co., Ltd. HangZhou, China). The combination of the two molecules [IGFBP-7*TIMP-2] was evaluated using the following formula, which is reported to be more valuable than individual measurements of IGFBP-7 and TIMP-2 in predicting acute kidney injury(9,17,18):
The rat kidneys fixed in 10% neutral buffered formalin solution for histopathological examination were subjected to standard tissue-processing steps in an automated device and embedded in paraffin blocks. Four µm-thick sections, on average, were cut from each block using a microtome and mounted on three slides, one of which was stained with Hematoxylin and Eosin (H&E), one with Periodic acid Schiff (PAS) for morphological assessment and one using the terminal deoxynucleotidyl transferase-mediated dUTP nick-end labeling technique (TUNEL), using ApopTag® Peroxidase In Situ Apoptosis Detection Kit for the assessment of apoptosis. The tissue sections prepared for examination were assessed by an experienced pathologist under a light microscope attached to a camera (Olympus BX53F; Tokyo, JAPAN) in a blind manner. Tubular necrosis and dilatation, vacuolar degeneration, the loss of the brush border and the cast development, as well as the ratio of findings in the percentage of tubules, were assessed to determine the tubular damage score. Using the Tubular Damage Scoring system, the damage grade is expressed at five levels: no damage=0, 1–10% = 1, 11–25% = 2, 26–50% = 3, 51–75% = 4, >75% = 5 (19,20). For the assessment of apoptosis, the number of TUNEL-positive nuclei in a total of 10 HPF was detected on the slides prepared using the TUNEL method.
Statistical analysis
The data was assessed using SPSS Statistics (Version 19.0. Armonk, NY:IBM Corp.), and tested for normality of distribution, with the results. Expressed as mean ± standard deviation (SD). A Kruskal Wallis test was used for multiple comparisons; a Mann-Whitney U test with Bonferroni correction was used for paired group comparisons; and the relationships between variables were analyzed using Pearson’s correlation coefficient. The cut-off point for the area under the curve in a ROC curve analysis was considered as 0.5. The level of significance was set to p< 0.05 in all statistical tests.
Results
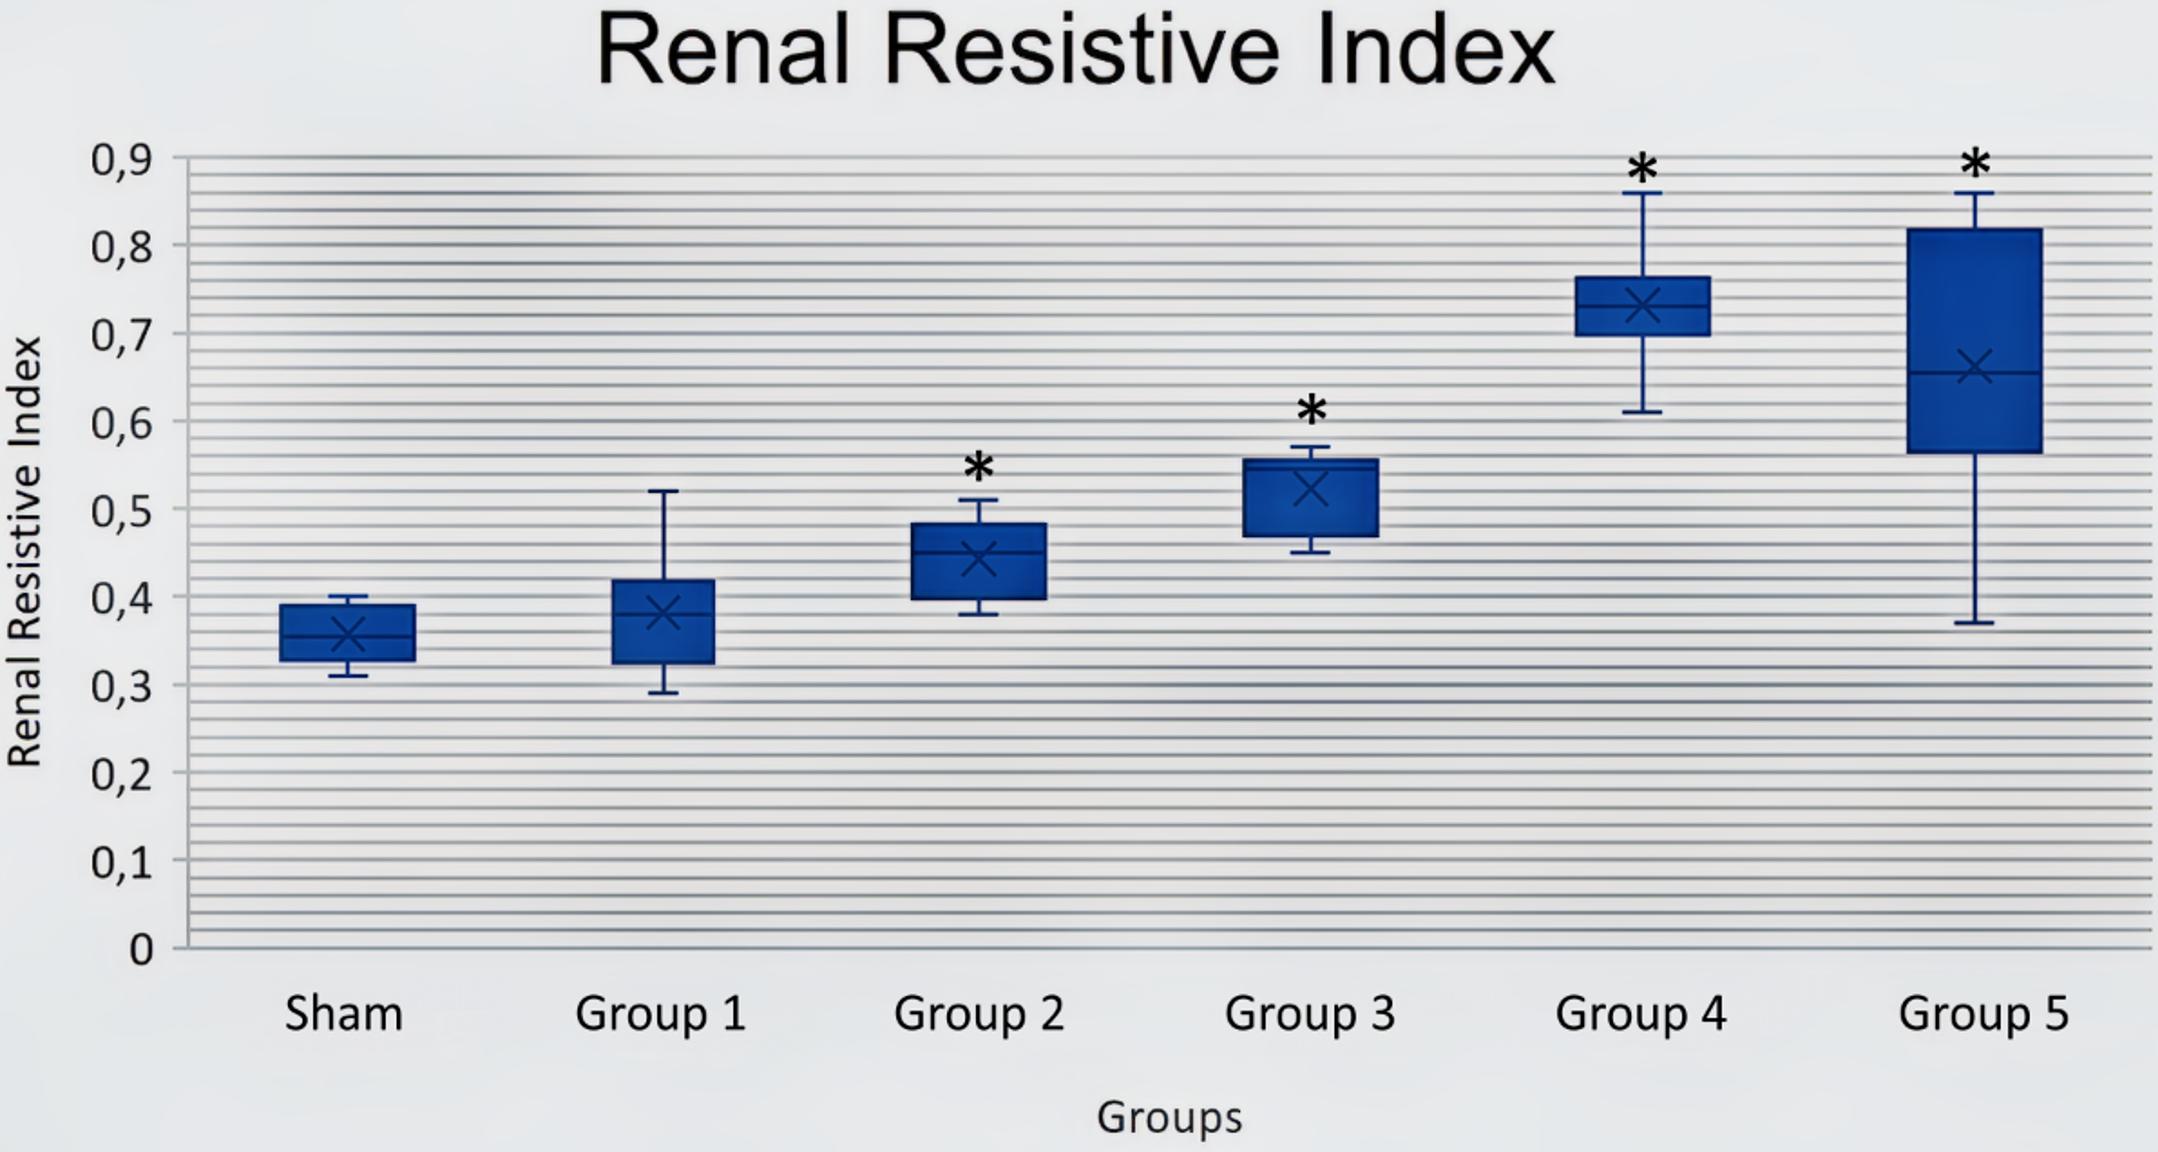
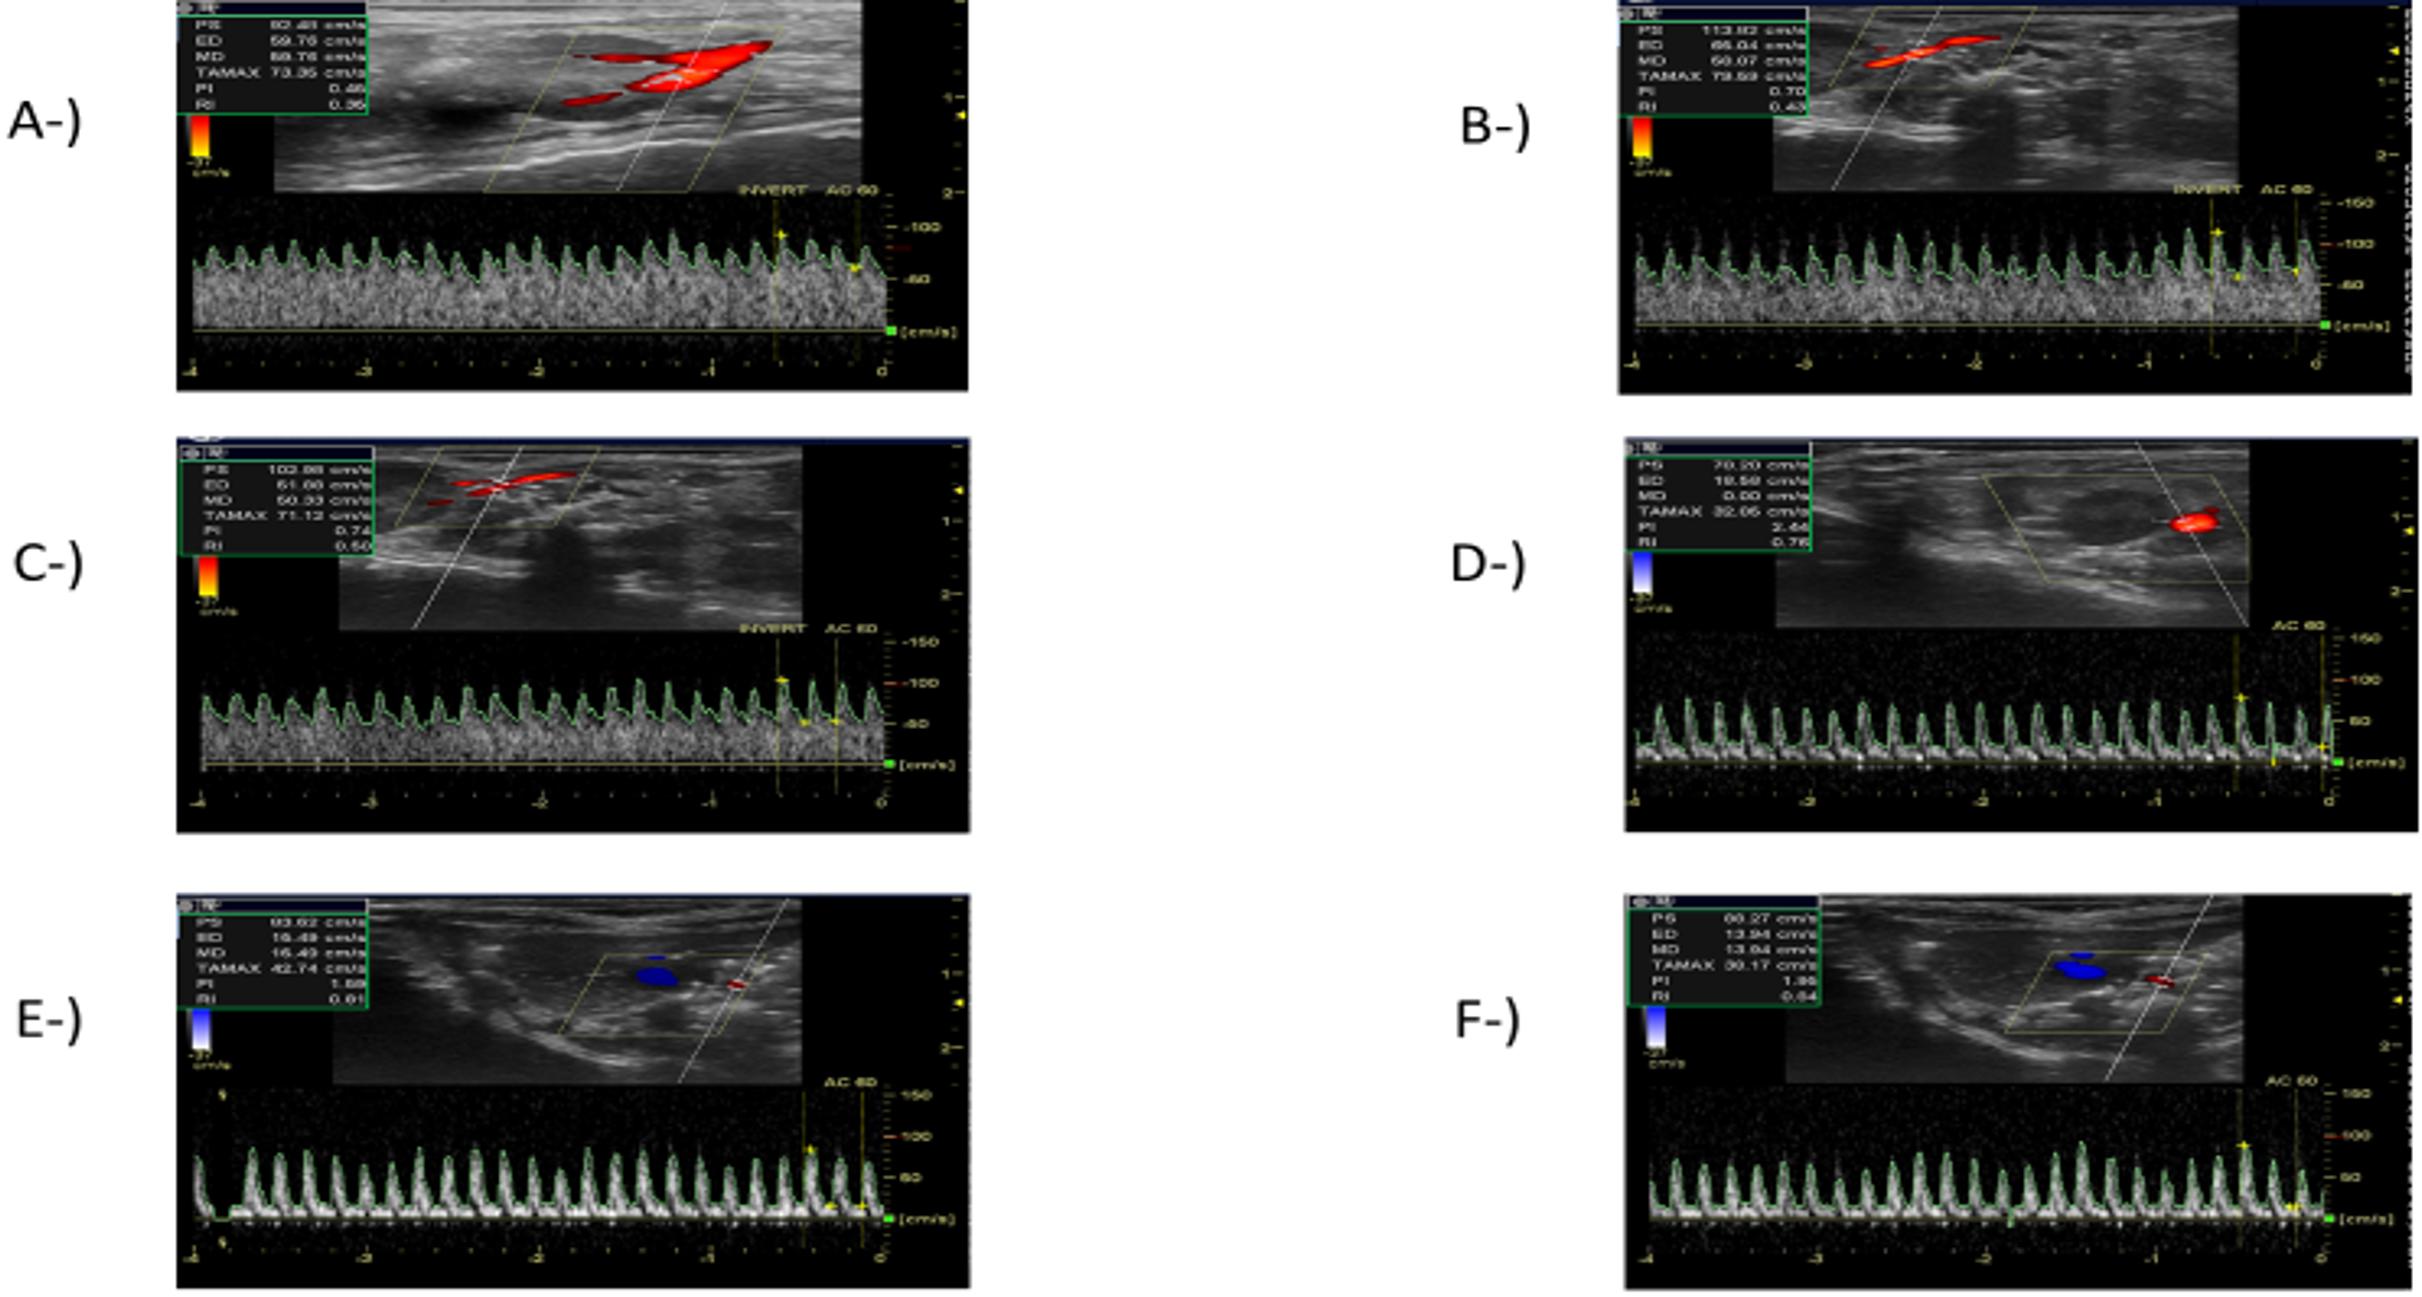
RRI was evaluated using a renal Doppler USG, 3, 6, 12, 24 and 48 hours after the CLP procedure. RRI started increasing 3 hours (0.38 ± 0.07) after the CLP procedure when compared to the sham group (0.36 ± 0.03), while the increase in RRI started to become significant at 6 hours (0.44 ± 0.04) and peaked at 24 hours (0.73 ± 0.02) after the CLP procedure. Although the increase in RRI tended to decrease at 48 (0.66 ± 0.15) when compared with the mean value at 24 hours (0.73 ± 0.02) after the CLP procedure, the difference was not statistically significant (p>0.05) (Figure 1). The RRI measurements in the sham group and at different time points after the CLP procedure are presented in Figure 2.
IGFBP-7 significantly increased at 3 hours (Group1) after the CLP procedure when compared to the sham group (P<0.05), and TIMP-2 significantly increased at 6 hours (Group 2) after the CLP procedure when compared to the sham group (P<0.05). A further comparison of the rats in the sham group revealed that both IGFBP-7 and TIMP-2 molecules were significantly increased in the other groups (P<0.05), with the highest levels of the two molecules observed 48 hours after the CLP procedure (Table 1). The combined analysis of the two molecules [(IGFBP-7×TIMP-2)÷1000 ] showed a significant increase at 3 hours after the CLP procedure when compared to the sham group (P<0.05); and while the values in the test groups remained significantly higher than in the sham group (P<0.05), the highest values were observed at 48 hours after the CLP procedure (Table 1). A statistical analysis of serum creatinine and lactate levels is presented in Table 1.
|
Sham: CLP procedure not performed; Group 1: Measurement 3 hours after the CLP procedure; Group 2: Measurement 6 hours after the CLP procedure; Group 3: Measurement 12 hours after the CLP procedure; Group 4: Measurement 24 hours after the CLP procedure; Group 5: Measurement 48 hours after the CLP procedure; CLP, Cecal ligation and puncture; IGFBP-7, Insulin-Like Growth Factor Binding Protein-7; TIMP-2, Tissue Inhibitor of Metalloproteinase-2. *P<0.05, compared with the sham; †P<0.05, compared with group 1; #P<0.05, compared with group 2; πP<0.05, compared with group 3. CLP, cecal ligation and puncture. |
|||||
| Table 1. Creatinine, lactate, IGFBP-7, TIMP-2, and [IGFBP-7*TIMP-2] values of the groups (Mean ± SD) | |||||
| Groups |
|
|
|
|
|
| Sham |
|
|
|
|
|
| Group 1 |
|
|
|
|
|
| Group 2 |
|
|
|
|
|
| Group 3 |
|
|
|
|
|
| Group 4 |
|
|
|
|
|
| Group 5 |
|
|
|
|
|
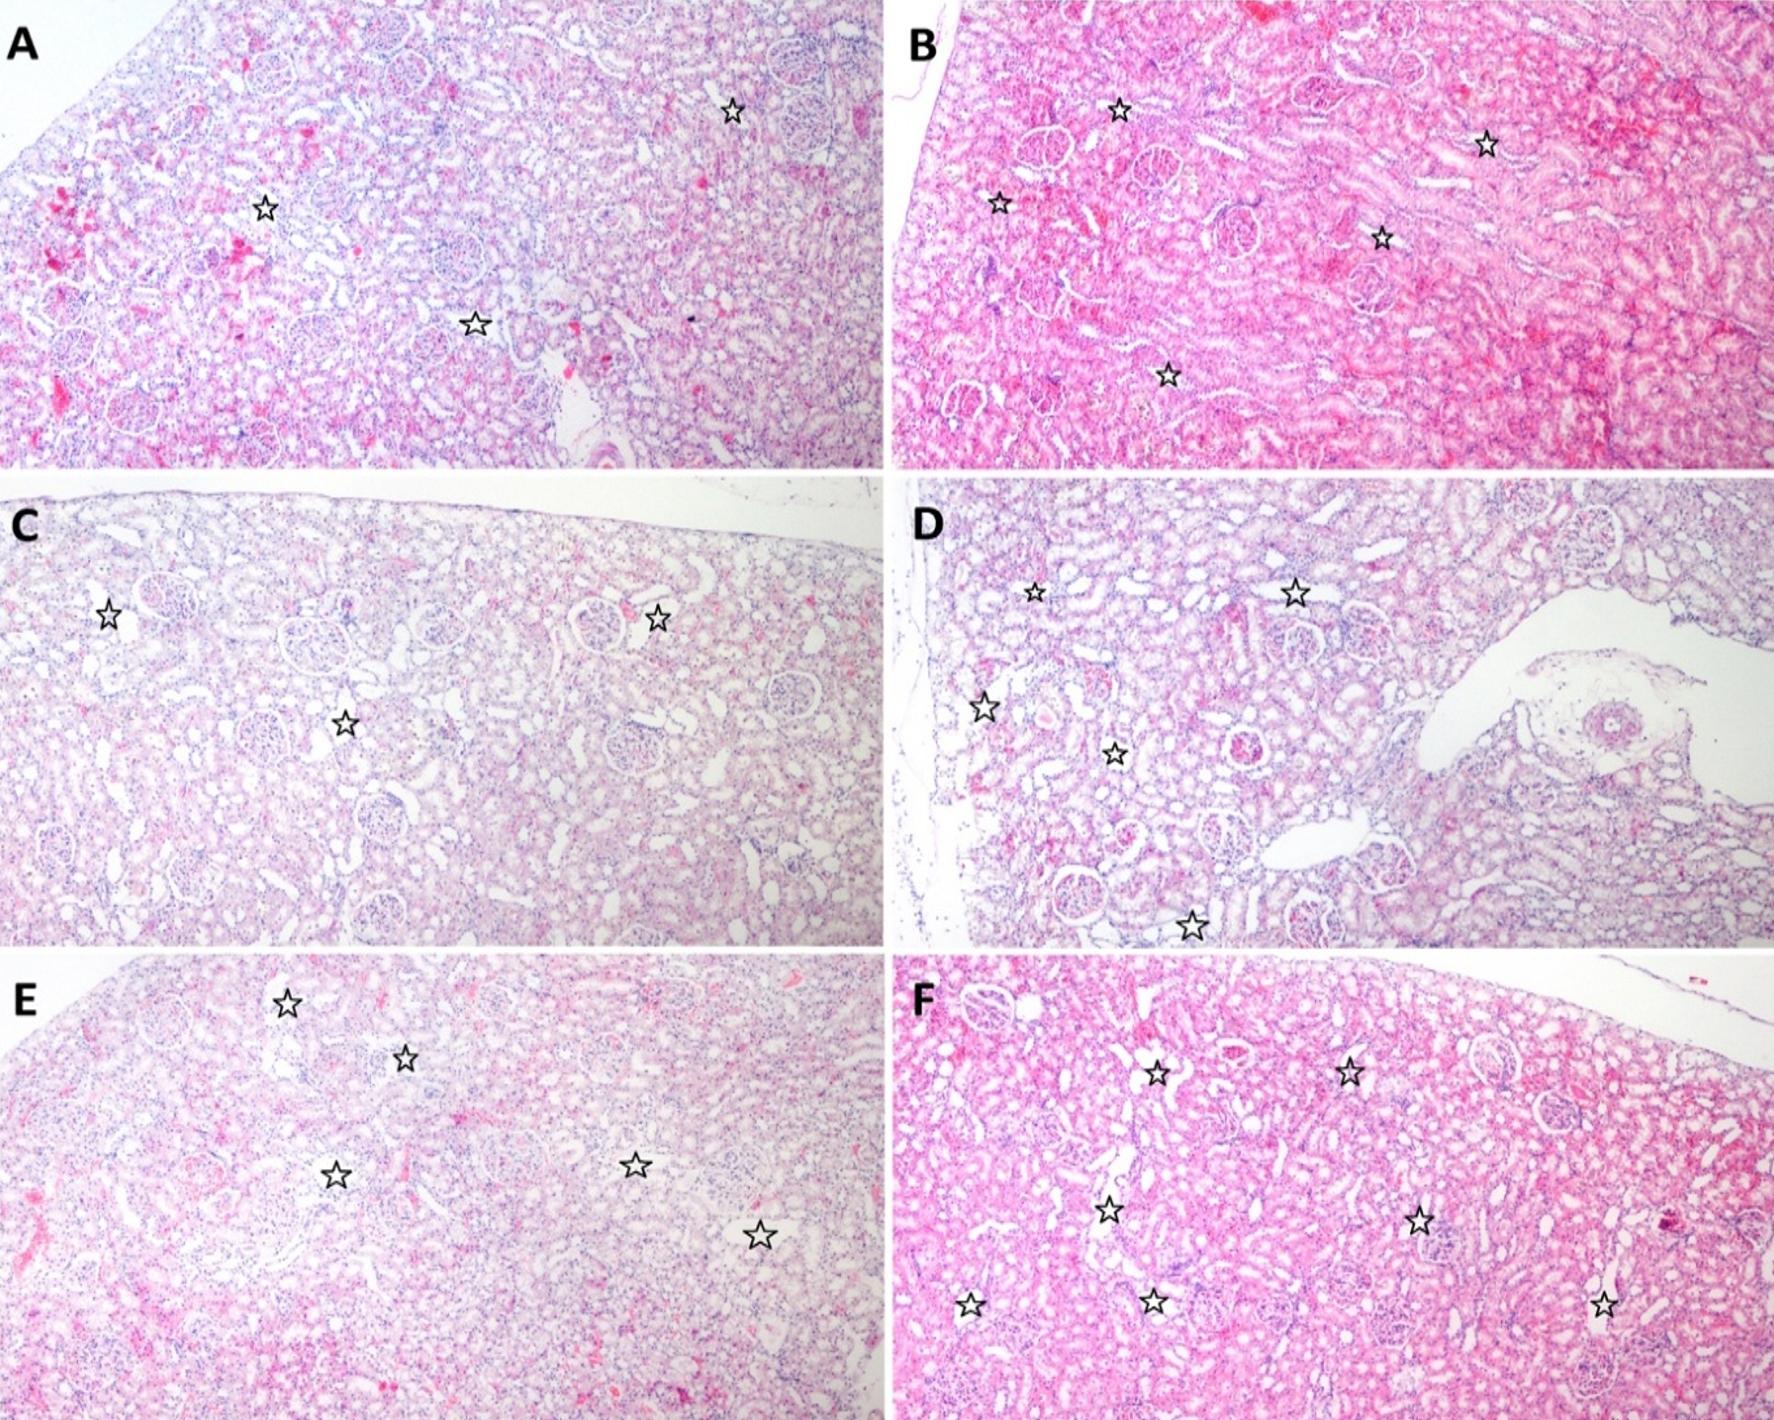
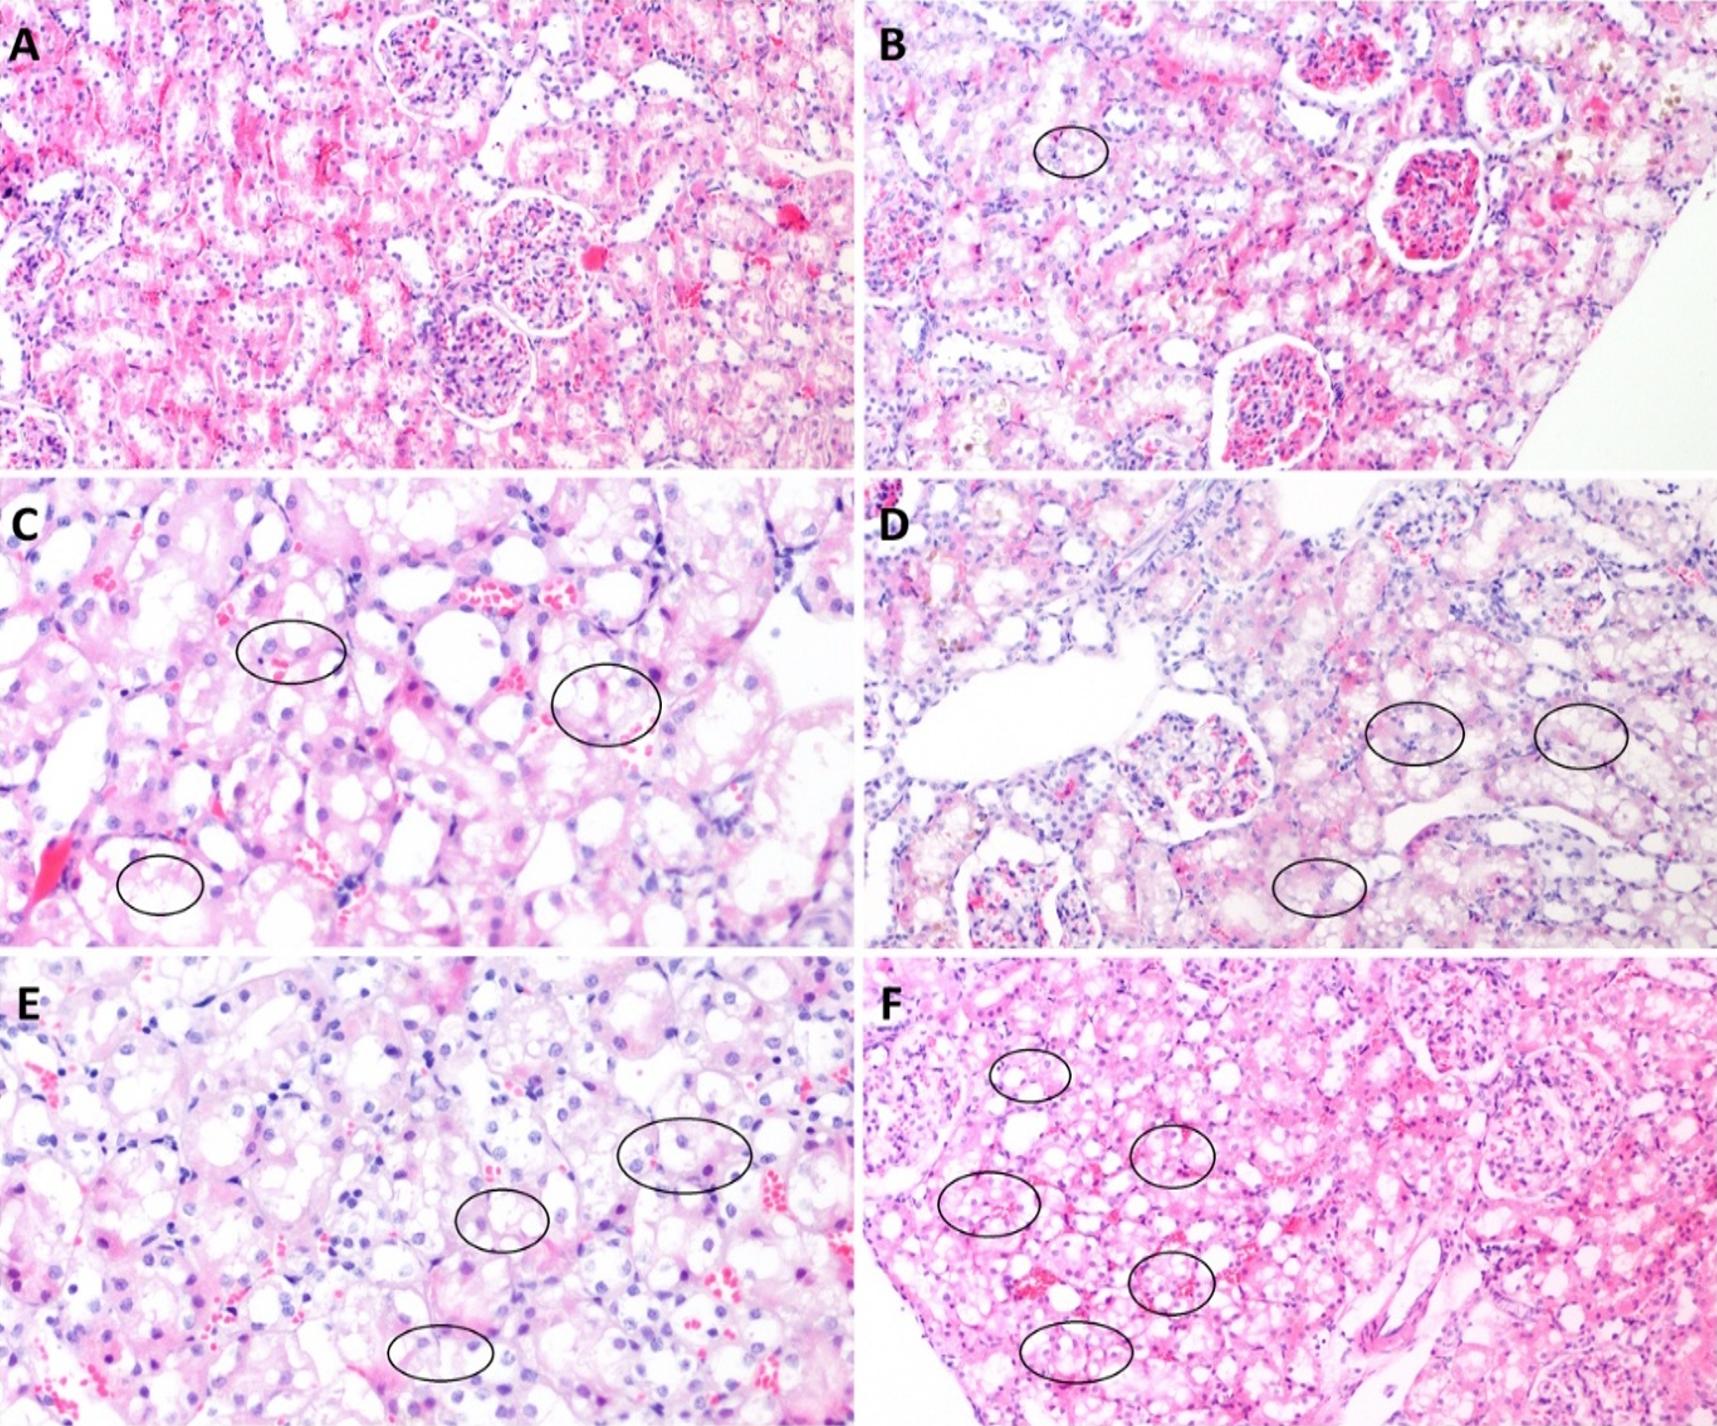
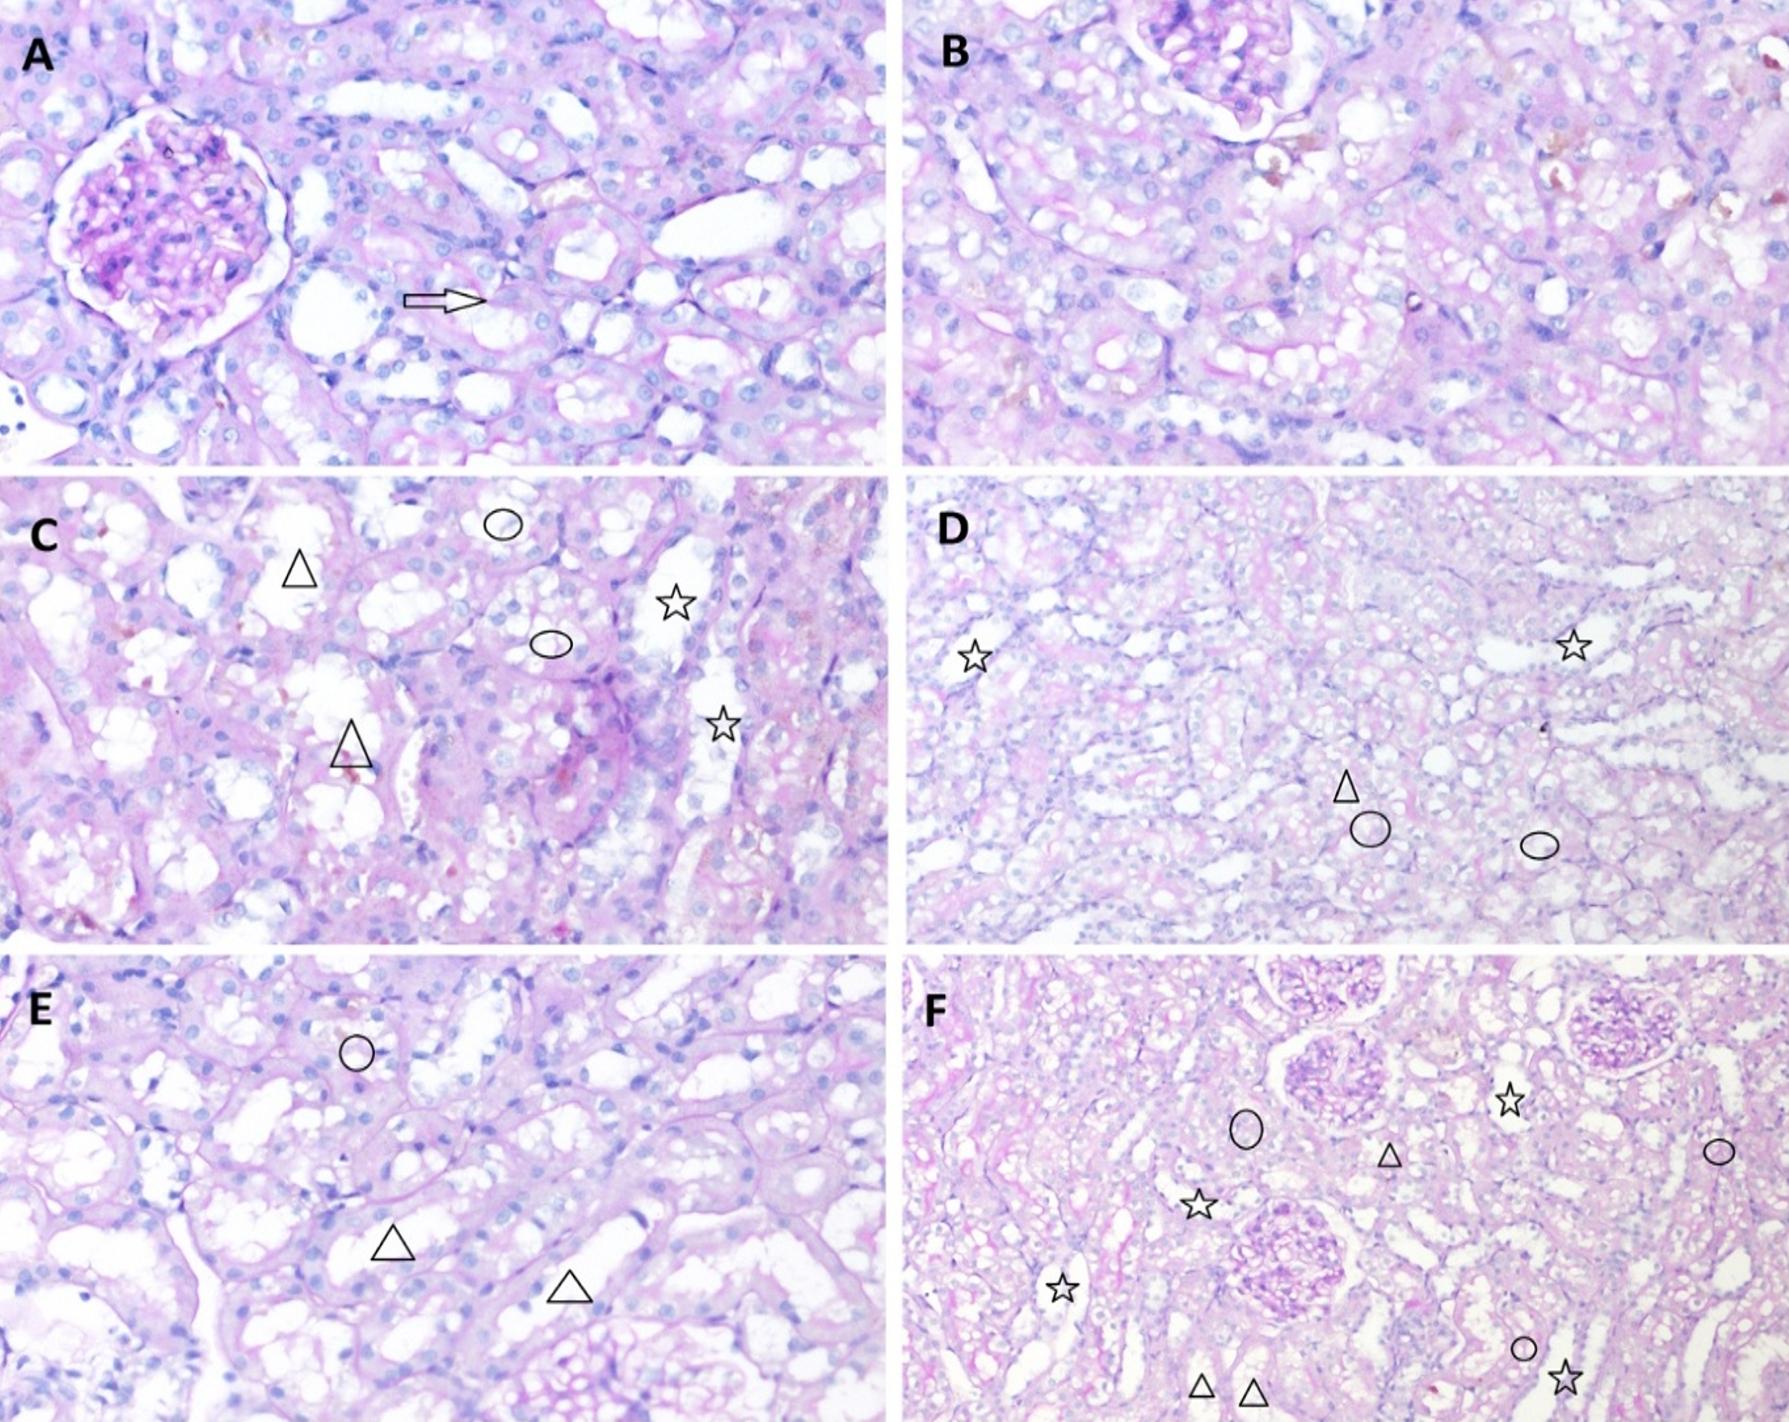
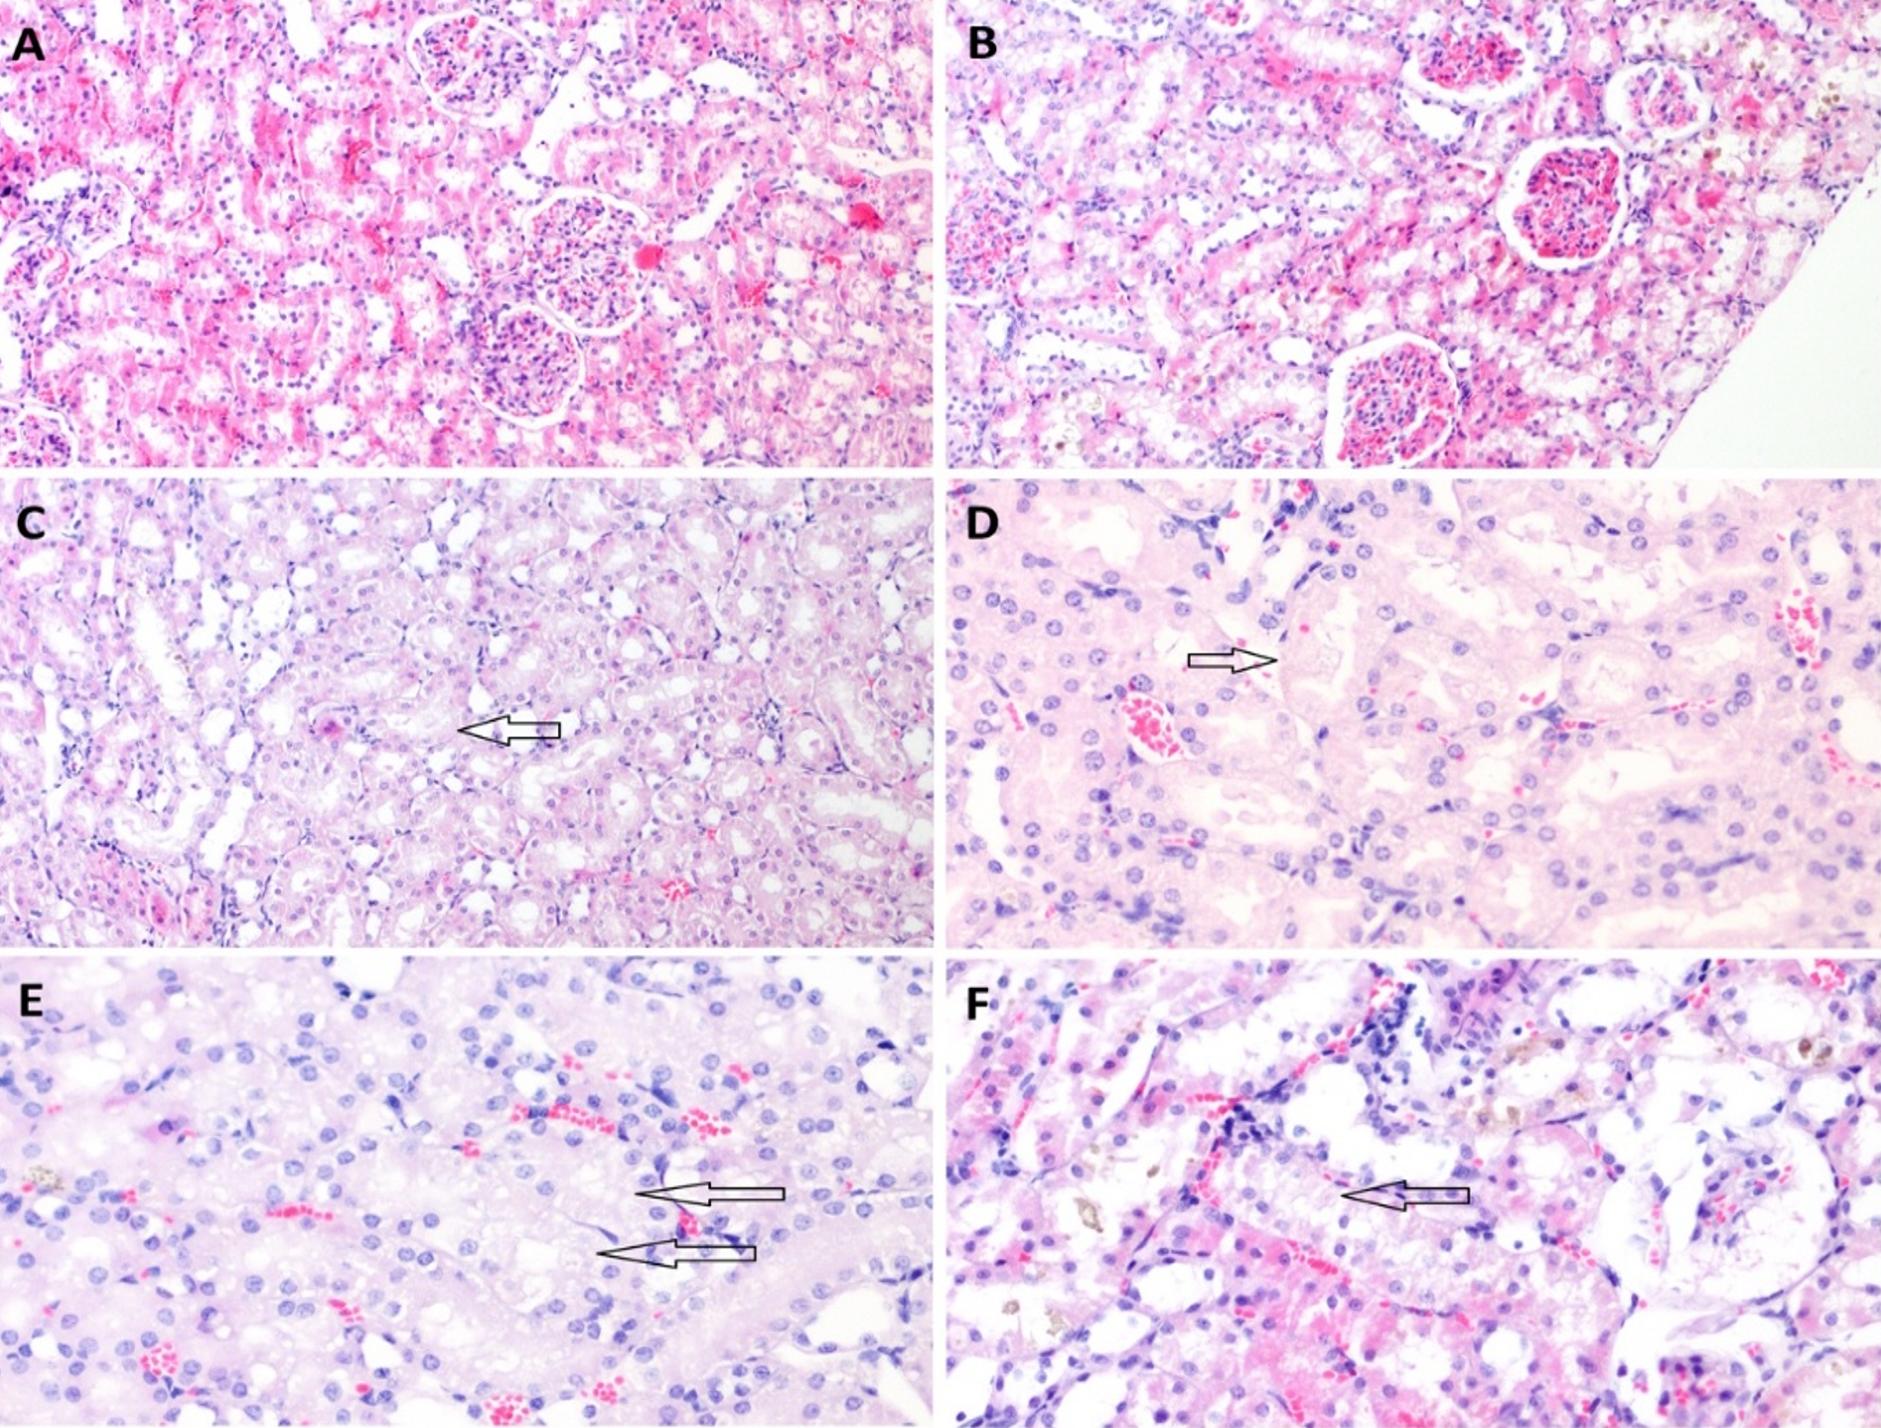
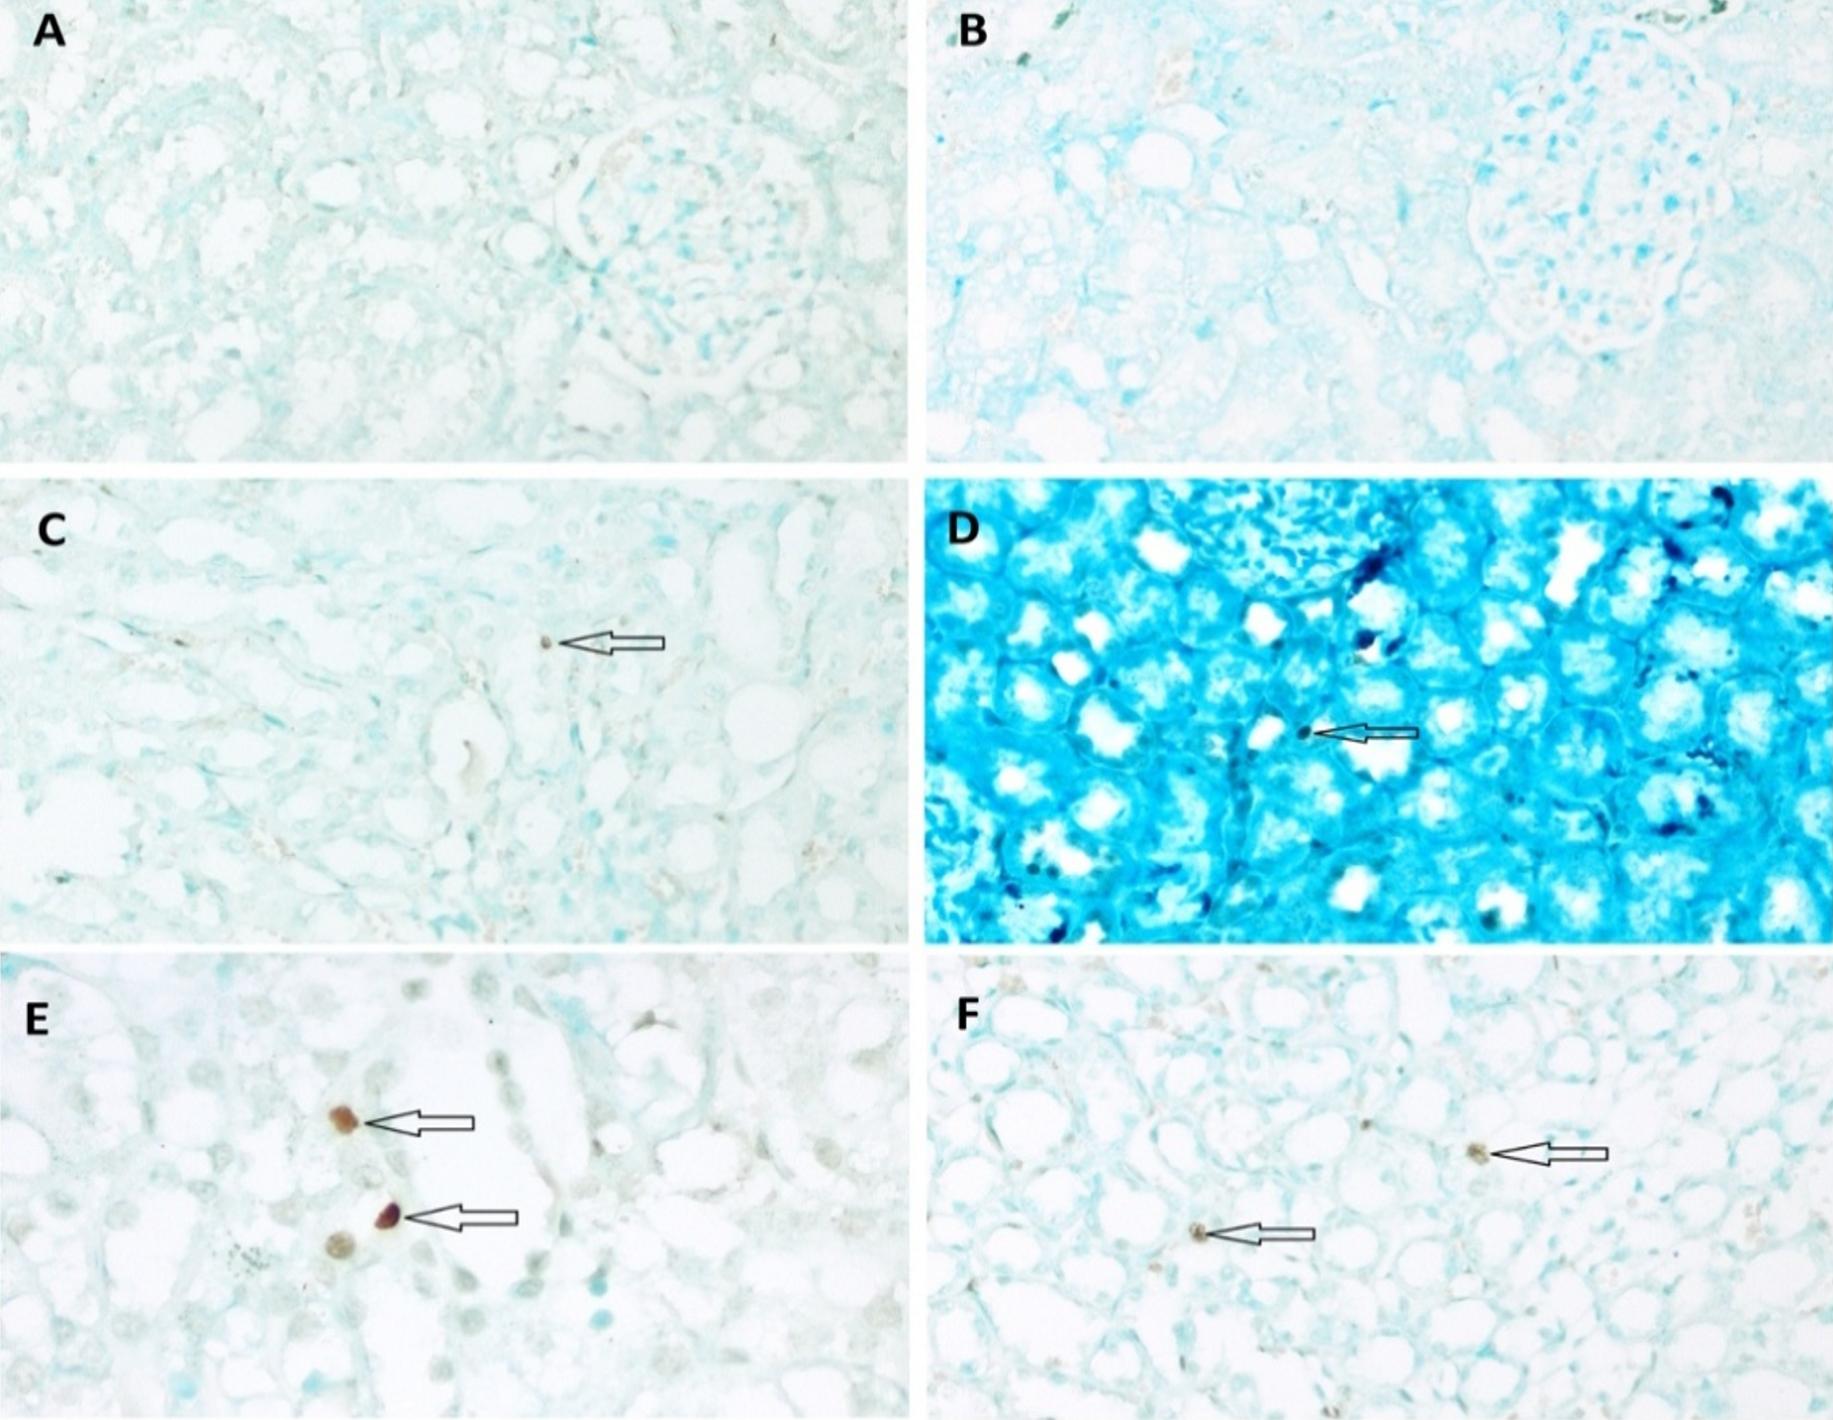
The tissue samples were subjected to a histopathological examination and examined for the presence of tubular necrosis, loss of brush-border, cast formation, vacuolization, and tubular dilatation, in an evaluation of tubular damage. The loss of brush-border, tubular dilatation and vacuolization were the prominent findings in a histopathological examination following the CLP procedure (Figure 3-6). The Tubular Damage Score was used to grade the pathological damage (Table 2) and was significantly higher in Group 1 (at 3 hours after the CLP procedure) than in the sham group, with the highest damage score observed in Group 5 (Table 3). The percentage of apoptosis was similar across the groups when compared to the sham group (P>0.05), and there was no significant difference between the groups (P<0.05) (Table 3 and Figure 7).
| Table 2. Tubular damage score (19,20) | |
| Percentage of Damage (%) | Damage Score Grade |
| 0% | 0 (No damage) |
| 1-10% | Grade 1 |
| 11-25% | Grade 2 |
| 26-50% | Grade 3 |
| 51-75% | Grade 4 |
| ≥ 76% | Grade 5 |
| Table 3. Tubular Damage Score and the number of TUNEL-positive nuclei (apoptosis) in the groups (Mean ± SD) | ||
| Groups | Tubular Damage Score | Apoptosis (n) |
| Sham | 0 | 1.40 ± 0.97 |
| Group 1 | 1.50 ± 0.71* | 1.00 ± 0.67 |
| Group 2 | 2.06 ± 1.03* | 1.10 ± 0.74 |
| Group 3 | 4 ± 0.81* † | 1.20 ± 0.63 |
| Group 4 | 4.40 ± 0.52*†# | 2.10 ± 1.10 |
| Group 5 | 4.90 ± 0.32* †#π | 1.60 ± 1.17 |
|
Sham: CLP procedure not performed; Group 1: Measurement 3 hours after the CLP procedure; Group 2: Measurement 6 hours after the CLP procedure; Group 3: Measurement 12 hours after the CLP procedure; Group 4: Measurement 24 hours after the CLP procedure; Group 5: Measurement 48 hours after the CLP procedure; CLP, Cecal Ligation and Puncture; Apoptosis, number of TUNEL-positive nuclei. TUNEL, terminal deoxynucleotidyl transferase-mediated *P<0.05, compared with the sham; †P<0.05, compared with group 1; #P<0.05, compared with group 2; πP<0.05, compared with group 3. CLP, cecal ligation and puncture. |
||
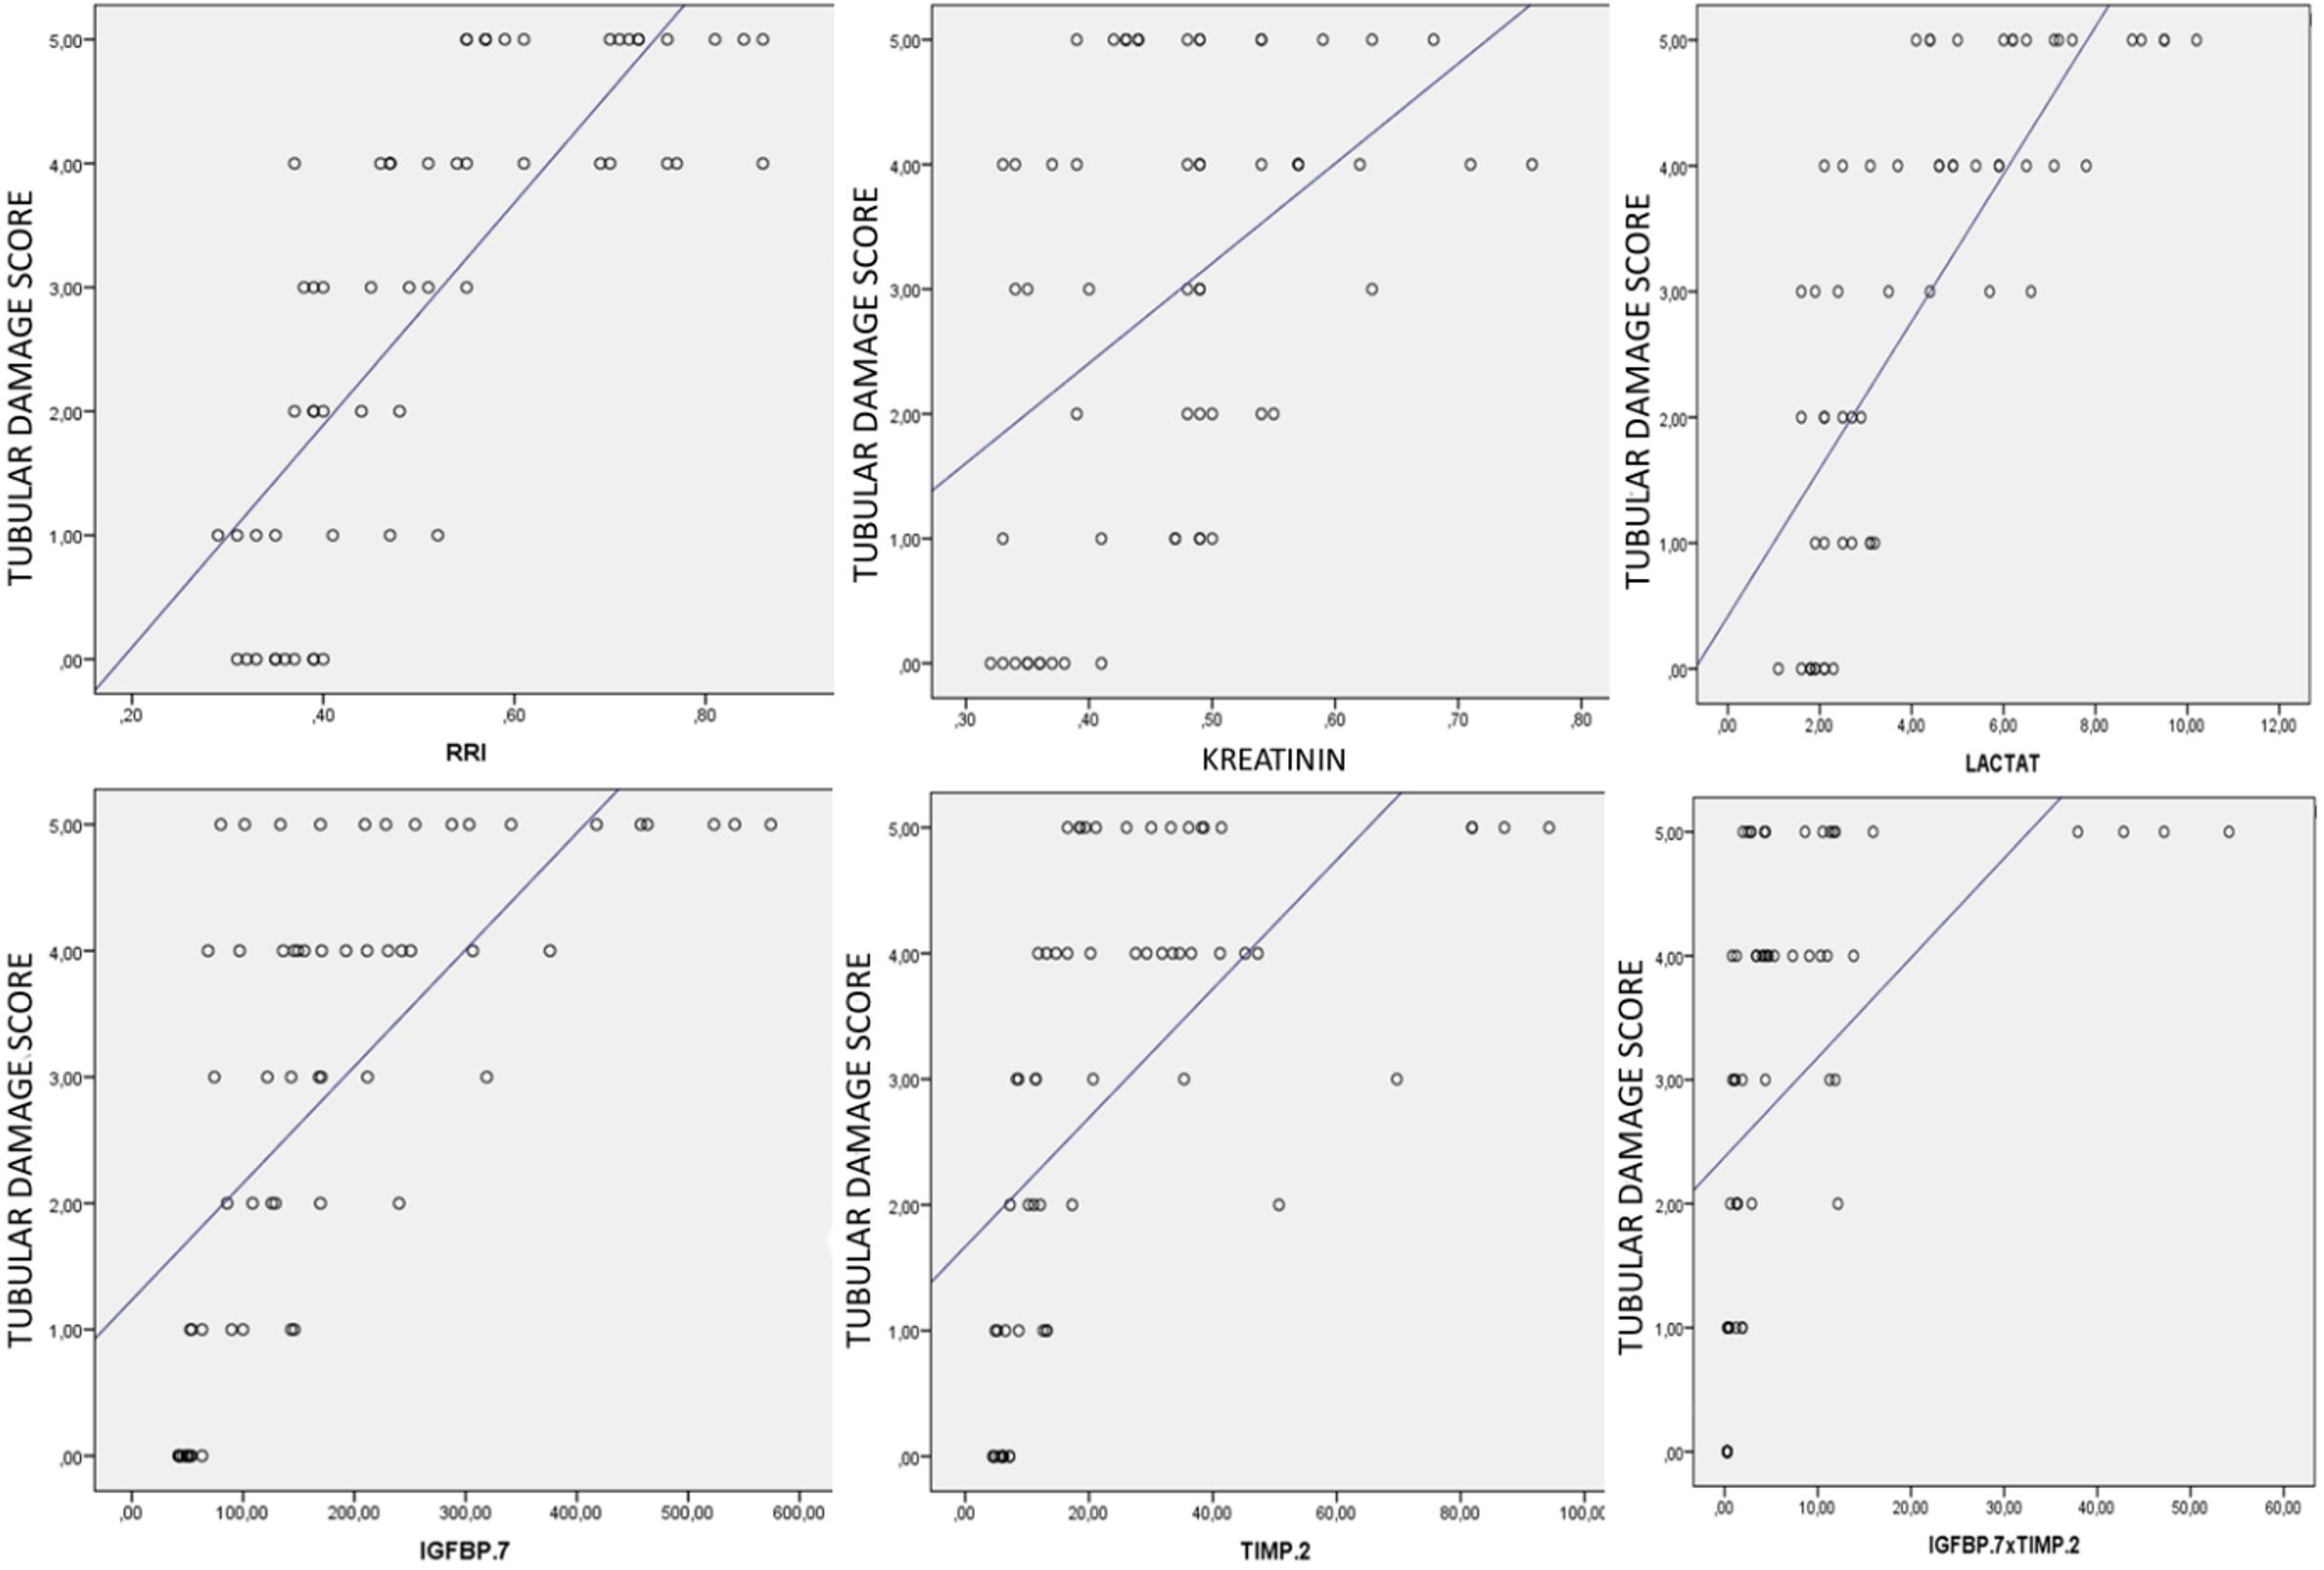
In an analysis of the correlation between the degree of histopathological damage in the kidneys occurring after the CLP procedure and the levels of urinary CCAB, a strong positive correlation was found between the degree of histopathological injury and IGFBP-7 (Spearman’s p=0.764, P<0.0001), TIMP-2 (Spearman’s p=0.779, P<0.0001) and [IGFBP- 7*TIMP-2] (Spearman’s p=0.785, P<0.0001). Furthermore, there was a moderate positive correlation between serum creatinine levels and the degree of histopathological damage (Spearman’s p=0.412, P<0.01). The strongest correlation was noted between the RRI measurements and the degree of histopathological damage at different time points after the CLP procedure (Spearman’s p=0.837, P<0.0001). There was also a significant correlation between blood lactate levels and histopathological findings in this rat model of sepsis (Spearman’s p=0.816, P<0.0001). The correlations between the degree of histopathological damage and CCAB, serum creatinine, lactate and RRI are shown in Figure 8.
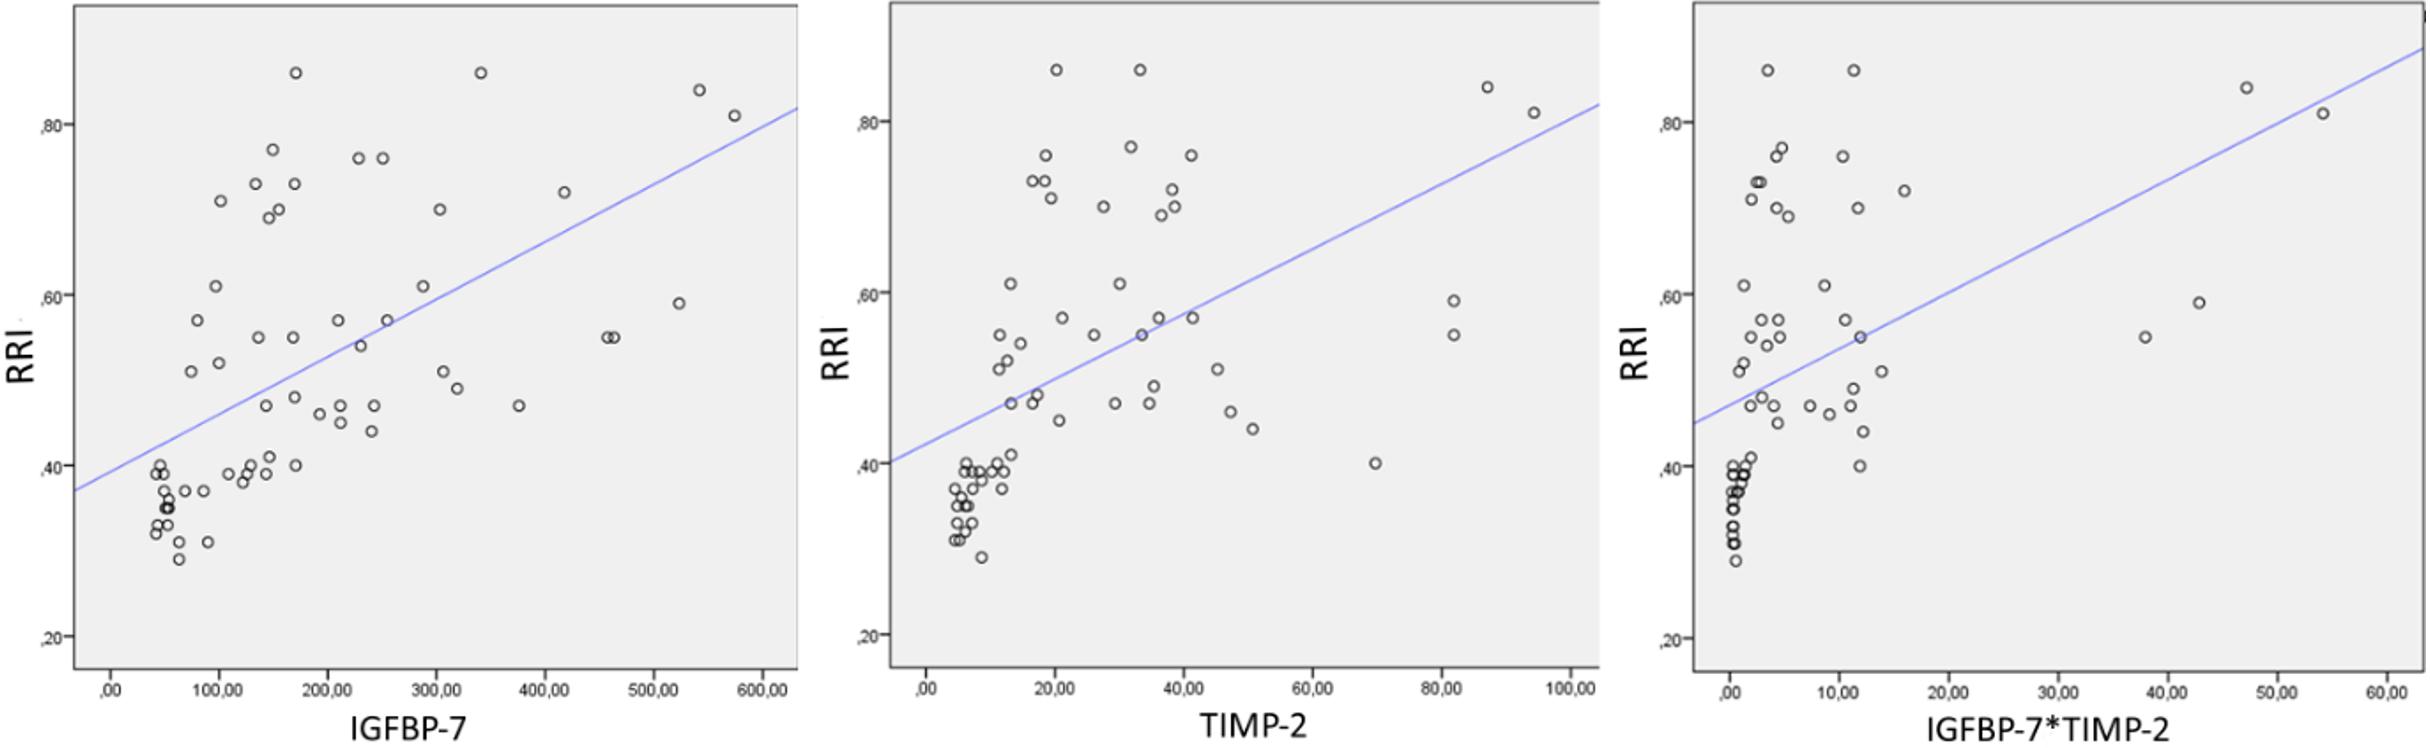
An analysis of the correlation between RRI and CCAB also showed a strong positive correlation between RRI and IGFBP-7 (Spearman’s p=0.686, P<0.0001), TIMP-2 (Spearman’s p=0.732, P<0.0001) and [IGFBP-7*TIMP-2’] (Spearman’s p=0.718, P<0.0001) (Figure 9).
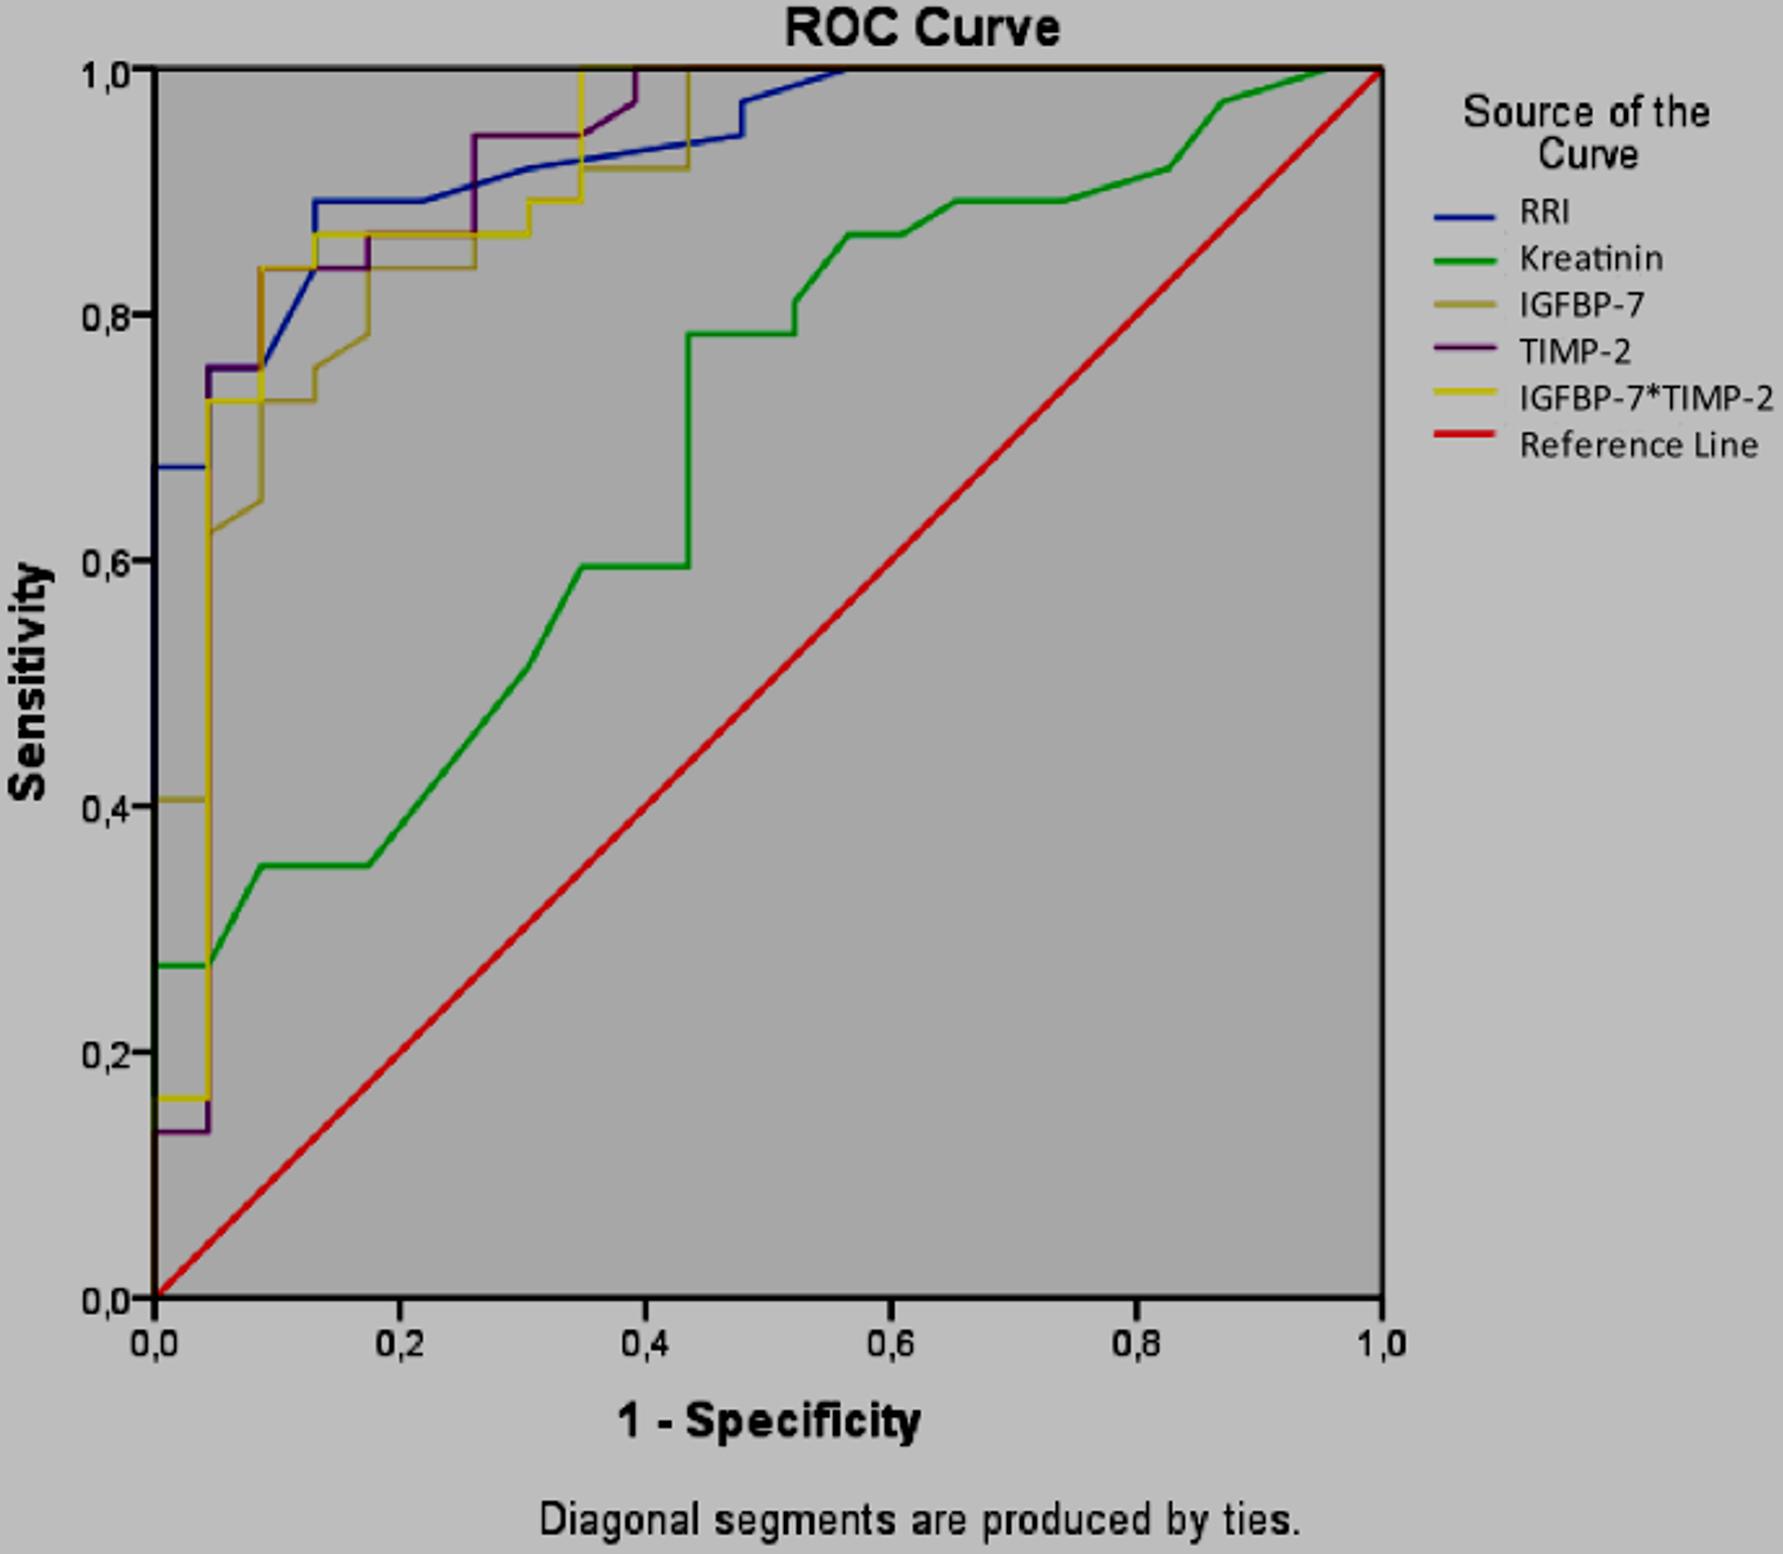
RRI, CCAB and serum creatinine were further evaluated in a ROC curve analysis to identify their ability to predict a histopathological tubular damage score of 3 or greater (more than 25% injury) (Figure 10). In the present study, an IGFBP-7 value greater than 131.3 ng/ml (84% sensitivity, 83% specificity), a TIMP-2 value greater than 12.87 ng/ml (86% sensitivity, 84% specificity) and a [IGFBP-7*TIMP-2] greater than 1.91 (ng/ml)2 (87% sensitivity, 86% specificity) predicted renal injury. An RRI greater than 0.45 predicted renal injury with a sensitivity of 89% and a specificity of 87%.
Discussion
In this rat model of sepsis, RRI was measured at 3, 6, 12, 24 and 48 hours after the CLP procedure to identify any impairment in renal circulation in the early period, which is considered an early sign of SI-AKI (11,14). Increases in RRI values were noted starting at 3 hours after the CLP procedure, and this increased to reach statistical significance at 6 hours. As reported by Song et al. in a study of human subjects evaluating the ability of RRI to detect SI-AKI in the early period, the pulsed-wave Doppler spectrum of the AKI group showed a narrow and steep waveform character that resulted in a high RRI value, similar wave forms were noted in the present study, becoming narrow and spiky, and with an increase in RRI that paralleled the degree of kidney injury(21). The present study also identified a strong positive correlation between RRI values and the degree of tubular damage in a histopathological examination. The authors believe the change in RRI to be a result of the greater decrease in diastolic blood flow than in the systolic blood flow, which we attributed to the increase in renal vascular resistance caused by sepsis induced-inflammation and the impairment of microvascular functions.
A Color Doppler USG can non-invasively visualize the effects of hemodynamic changes on the kidneys, such as vasoconstriction, hypoxia, stress response and shock (10,11). The monitorization of circulation using only the routinely-used method takes into account only macrocirculation, while RRI measured by Doppler USG reflects the resistance to flow rather than circulation (14). A decrease in renal diastolic pressure resulting from an increase in renal vascular resistance surpasses the decrease in systolic pressure. In the event of an extreme increase in renal vascular resistance, diastolic flow may not be detected, and even retrograde flow can be observed (12). RRI can be calculated by color Doppler USG for the identification of such alterations in renal vascular resistance.
The relationship between the alterations in kidney function and RRI, and the pulsatility index (PI) measured by color Doppler USG was investigated in a cisplatin-induced renal toxicity model, and reported small animal sonography to be a non-invasive, sensitive and reproducible method requiring a minimum number of laboratory animals, and to be an effective tool in the calculation of RRI in the early detection of drug-induced nephrotoxicity in rat models (22). A study involving rabbits reported a significant increase in RRI 6 hours after the development of AKI, and a cut-off point of 0.7 significantly predicted AKI in an earlier period than serum creatinine. A ROC curve analysis was performed in the present study to test whether RRI can effectively identify kidney injury in the early period in cases with a tubular damage score of 25% or greater. RRI greater than 0.45 predicted kidney damage of 25% of greater, with a sensitivity of 89% and a specificity of 87%. Studies conducted on intensive care unit patients using RRI to predict AKI have failed to identify whether an increase in RRI indicates a risk or true damage in the kidneys due to the inability to perform a histopathological examination, although these studies report RRI to perform better than urine output and serum creatinine measurement in predicting AKI in critically ill patients, regardless of the etiology (23-25). The study by Darmon et al. reported that an RRI greater than 0.795 predicted AKI with a sensitivity of 92% and a specificity of 85% (24).
Our findings regarding the predictive value of RRI for sepsis-associated acute kidney injury demonstrate notable concordance with the clinical study by Huang et al. In the clinical cohort study by Huang and colleagues, RRI exhibited a sensitivity of 93% with a specificity of 35.3% (AUC=0.667, p=0.004) for predicting SI-AKI in human patients (26). In contrast, our experimental sepsis model demonstrated that an RRI threshold greater than 0.45 predicted renal injury with a sensitivity of 89% and specificity of 87%, alongside the strongest correlation with histopathological damage (Spearman’s p=0.837, p<0.0001).
In the presence of ischemia or sepsis, renal tubular cells undergo G1 cell cycle arrest, and a G1-phase arrest of the cell cycle prevents cell division until the DNA damage is repaired (27). Cell cycle arrest occurs in the early period immediately after damage. There is a growing body of evidence suggesting that IGFBP-7 and TIMP-2 are closely related to the regulation of the cell cycle by mitochondria, and that cell cycle arrest may be an important cellular defense strategy in the case of sepsis (3,28). Furthermore, both molecules act as “alarm” proteins through their autocrine and paracrine effects on the cells, with the alarm signal being released from the damaged area (29-31). In the case of SI-AKI, where early interventions are of great importance, the detection of this signal may provide as much to the early timing of management strategies as to changes in the outcomes (32-34). In the present study, IGFBP-7 showed a significant increase from 3 hours after the CLP procedure, whereas TIMP-2 increased significantly at 6 hours. Both IGFBP-7 and TIMP-2 were higher at all measurement points when compared to the values in the sham group, with the highest values for the two molecules detected 48 hours after the CLP procedure. A correlation analysis revealed a strong positive correlation between the degree of tubular damage and CCAB, although a combined analysis of the two molecules ([IGFBP-7]x[TIMP-2]) even showed an even stronger correlation than with individual measurement of the molecules.
In a ROC curve analysis to evaluate the performance of these molecules in predicting kidney injury, a [IGFBP-7]x[TIMP-2] value greater than 1.91 (ng/ml)2 significantly predicted AKI with a sensitivity of 87% and a specificity of 86%. This cut-off point, which is closer to the cut-off point of 2.0 (ng/ml)2 reported in other studies, can detect pathological damage with a sensitivity of 87%. The present study did not analyze the changes in cell cycle arrest molecules during the recovery period, which can be noted as a limitation of the present study (8,9,35,36).
Similar to the findings of the present study, a study of a rat model of SI-AKI using the CLP method reported that IGFBP-7 increased significantly earlier than TIMP-2 (12 hours) and suggested that the combined analysis of the two molecules offers higher sensitivity than serum creatinine in the diagnosis of AKI (37). The same study also reported peak serum urea and creatinine concentrations to be observed at 3 hours, and that high hematocrit levels at this time point caused an increase in serum creatinine due to hemoconcentration. After the initiation of fluid resuscitation at 2 hours, the authors reported a progressive decrease to normal in the serum urea and creatinine concentrations between 6 and 12 hours. The same study reported that a significant increase was noted in serum urea and creatinine concentrations after 24 hours, with the highest serum creatinine being 1.5 times higher (30µmol/L) than the baseline. Similar to the findings in the study by Arulkumaran et al. the authors of the present study consider the decrease in serum creatinine at 6 hours to be attributable to fluid resuscitation in this sepsis model (37). In a correlation analysis, the weakest correlation was observed between tubular damage and serum creatinine. As mentioned earlier in several studies, the present study confirms the findings that CCAB increase at an earlier time point and are more specific biomarkers than serum creatinine (31,37).
Our review of literature revealed no studies evaluating the combined used of RRI and CCAB in the early diagnosis of SI-AKI. Furthermore, there were only two studies, conducted by the same investigators, evaluating the combined used of RRI and CCAB in patients undergoing open heart surgery. The investigators in these studies attempted to determine the predictive value of these new biomarkers in a specific population undergoing open heart surgery and (TAVI) transcatheter aortic valve implantation, who are considered to be at high risk of developing AKI following the procedure (38,39). The investigators reported that both RRI and urinary [TIMP-2]*[IGFBP-7] failed to predict the development of AKI within 24 hours of surgery in the two groups of patients. In a study involving patients undergoing open heart surgery, Zaouter et al. reported that the combined use of RRI and [IGFBP-7]x[TIMP-2] was incapable of recognizing patients within clinically acceptable limits who may develop AKI within 24 hours of surgery, although they reported a slightly increased negative predictive value (38).
Zaitoun et al. demonstrated that RRI (T1≥0.72, AUROC=0.905) effectively diagnosed AKI but poorly predicted persistence, with Cystatin C emerging as the superior prognostic marker (AUROC=0.977) (40). In our experimental model, the predictive performance of RRI combined with CCAB for SI-AKI and their correlation with histopathological renal damage were investigated, revealing complementary insights. Notably, RRI demonstrated the strongest correlation with histopathological kidney damage (Spearman’s p=0.837, p<0.0001) in our study, surpassing even the CCAB, p=0.785). This suggests that RRI, when measured serially with appropriate timing, captures the hemodynamic and structural renal injury continuum more comprehensively than single-timepoint measurements.
In the analysis of correlation between RRI and CCAB in the present study, both methods showed a strong correlation in the detection of tubular damage. However, an RRI greater than 0.45 showed the highest predictive value in the early detection of AKI, with a sensitivity of 89% and a specificity of 87%. It is stated that the measurement RRI by Doppler USG is easily applicable, but has a steep learning curve (41), and studies have reported RRI measurements to have the potential to be affected by factors such as increased intraabdominal pressure, right ventricular dysfunction, renal venous pressure, renal congestion, tricuspid valve disease and certain mediations in critically ill intensive care unit patients with sepsis (21,42). For this reason, there is a need for large-scale clinical studies to support the current findings related to the early detection of AKI in patients with sepsis.
Tubular dilatation and vacuolization, and the loss of the brush-border, to a lesser extent, were the most prominent alterations associated with AKI in the histopathological examination carried out within our polymicrobial sepsis model, created using the CLP method. In contrast, no apoptosis or necrosis, which are commonly reported as the most striking histopathological findings of SI-AKI in literature, were identified. In the present study, an analysis of the urinary CCAB revealed TIMP-2 to increase earlier, and to predict AKI with a higher sensitivity and specificity than IGFBP-7 (37,43). However, a cut-off value of 1.91(ng/ml)2 for the combined use of the two molecules showed the highest sensitivity and specificity in the early detection of SI-AKI. Although RRI predicted SI-AKI in the early period at the same time points as CCAB, RRI showed a higher sensitivity and specificity than the other two molecules.
In conclusion, RRI and urinary CCAB predicted AKI in the early period almost at the same time intervals in our rat model of polymicrobial sepsis induced by the CLP method, although an RRI greater than 0.45 had the highest predictive value. There is a need for larger-scale clinical studies to support the findings of this experimental study into the early detection of SI-AKI.
Ethical approval
This study has been approved by the Necmettin Erbakan University KONÜDAM Experimental Medicine Application and Research Center Directorate Local Ethics Committee on Animal Experiments (approval date: 18.05.2018, number: 2018-018). Written informed consent was obtained from the participants.
Author contribution
Study conception and design: SOU, AY; data collection: SOU, EFC; analysis and interpretation of results: SOU, FK, SB, FG, CT; draft manuscript preparation: SOU, AY, EFC. The author(s) reviewed the results and approved the final version of the article.
Source of funding
The authors declare the study received no funding.
Conflict of interest
The authors declare that there is no conflict of interest.
References
- Evans L, Rhodes A, Alhazzani W, et al. Surviving sepsis campaign: ınternational guidelines for management of sepsis and septic shock 2021. Crit Care Med. 2021;49:e1063-143. https://doi.org/10.1097/CCM.0000000000005337
- Gómez H, Kellum JA. Sepsis-induced acute kidney injury. Curr Opin Crit Care. 2016;22:546-53. https://doi.org/10.1097/MCC.0000000000000356
- Gomez H, Ince C, De Backer D, et al. A unified theory of sepsis-induced acute kidney injury: inflammation, microcirculatory dysfunction, bioenergetics, and the tubular cell adaptation to injury. Shock. 2014;41:3-11. https://doi.org/10.1097/SHK.0000000000000052
- Jameson JL, Fauci AS, Kasper DL, Hauser SL, Longo DL, Loscalzo J. Harrison’s principles of internal medicine. 20th ed. New York: McGraw Hill Education; 2018.
- Coca SG, Yalavarthy R, Concato J, Parikh CR. Biomarkers for the diagnosis and risk stratification of acute kidney injury: a systematic review. Kidney Int. 2008;73:1008-16. https://doi.org/10.1038/sj.ki.5002729
- Aydoğdu M, Boyacı N, Yüksel S, Gürsel G, Sivri ABÇ. A promising marker in early diagnosis of septic acute kidney injury of critically ill patients: urine insulin like growth factor binding protein-7. Scand J Clin Lab Invest. 2016;76:402-10. https://doi.org/10.1080/00365513.2016.1187765
- Endre ZH, Pickering JW, Walker RJ, et al. Improved performance of urinary biomarkers of acute kidney injury in the critically ill by stratification for injury duration and baseline renal function. Kidney Int. 2011;79:1119-30. https://doi.org/10.1038/ki.2010.555
- Cuartero M, Ballús J, Sabater J, et al. Cell-cycle arrest biomarkers in urine to predict acute kidney injury in septic and non-septic critically ill patients. Ann Intensive Care. 2017;7:92. https://doi.org/10.1186/s13613-017-0317-y
- Kashani K, Al-Khafaji A, Ardiles T, et al. Discovery and validation of cell cycle arrest biomarkers in human acute kidney injury. Crit Care. 2013;17:R25. https://doi.org/10.1186/cc12503
- Bonnin P, Sabaa N, Flamant M, Debbabi H, Tharaux PL. Ultrasound imaging of renal vaso-occlusive events in transgenic sickle mice exposed to hypoxic stress. Ultrasound Med Biol. 2008;34:1076-84. https://doi.org/10.1016/j.ultrasmedbio.2007.12.003
- Sullivan JC, Wang B, Boesen EI, D’Angelo G, Pollock JS, Pollock DM. Novel use of ultrasound to examine regional blood flow in the mouse kidney. Am J Physiol Renal Physiol. 2009;297:F228-35. https://doi.org/10.1152/ajprenal.00016.2009
- Boddi M, Bonizzoli M, Chiostri M, et al. Renal resistive index and mortality in critical patients with acute kidney injury. Eur J Clin Invest. 2016;46:242-51. https://doi.org/10.1111/eci.12590
- Giustiniano E, Meco M, Morenghi E, et al. May renal resistive index be an early predictive tool of postoperative complications in major surgery? Preliminary results. Biomed Res Int. 2014;2014:917985. https://doi.org/10.1155/2014/917985
- Rozemeijer S, Haitsma Mulier JLG, Röttgering JG, et al. Renal resistive index: response to shock and its determinants in critically ill patients. Shock. 2019;52:43-51. https://doi.org/10.1097/SHK.0000000000001246
- Dyson A, Rudiger A, Singer M. Temporal changes in tissue cardiorespiratory function during faecal peritonitis. Intensive Care Med. 2011;37:1192-200. https://doi.org/10.1007/s00134-011-2227-z
- Rudiger A, Dyson A, Felsmann K, et al. Early functional and transcriptomic changes in the myocardium predict outcome in a long-term rat model of sepsis. Clin Sci (Lond). 2013;124:391-401. https://doi.org/10.1042/CS20120334
- Bihorac A, Chawla LS, Shaw AD, et al. Validation of cell-cycle arrest biomarkers for acute kidney injury using clinical adjudication. Am J Respir Crit Care Med. 2014;189:932-9. https://doi.org/10.1164/rccm.201401-0077OC
- Meersch M, Schmidt C, Van Aken H, et al. Urinary TIMP-2 and IGFBP7 as early biomarkers of acute kidney injury and renal recovery following cardiac surgery. PLoS One. 2014;9:e93460. https://doi.org/10.1371/journal.pone.0093460
- Ko SF, Chen YT, Wallace CG, et al. Inducible pluripotent stem cell-derived mesenchymal stem cell therapy effectively protected kidney from acute ischemia-reperfusion injury. Am J Transl Res. 2018;10:3053-67.
- Al-Harbi NO, Nadeem A, Ahmad SF, et al. Short chain fatty acid, acetate ameliorates sepsis-induced acute kidney injury by inhibition of NADPH oxidase signaling in T cells. Int Immunopharmacol. 2018;58:24-31. https://doi.org/10.1016/j.intimp.2018.02.023
- Song J, Wu W, He Y, Lin S, Zhu D, Zhong M. Value of the combination of renal resistance index and central venous pressure in the early prediction of sepsis-induced acute kidney injury. J Crit Care. 2018;45:204-8. https://doi.org/10.1016/j.jcrc.2018.03.016
- Fisch S, Liao R, Hsiao LL, Lu T. Early detection of drug-induced renal hemodynamic dysfunction using sonographic technology in rats. J Vis Exp. 2016;109:52409. https://doi.org/10.3791/52409
- Lerolle N, Guérot E, Faisy C, Bornstain C, Diehl JL, Fagon JY. Renal failure in septic shock: predictive value of Doppler-based renal arterial resistive index. Intensive Care Med. 2006;32:1553-9. https://doi.org/10.1007/s00134-006-0360-x
- Darmon M, Schortgen F, Vargas F, et al. Diagnostic accuracy of Doppler renal resistive index for reversibility of acute kidney injury in critically ill patients. Intensive Care Med. 2011;37:68-76. https://doi.org/10.1007/s00134-010-2050-y
- Dewitte A, Coquin J, Meyssignac B, et al. Doppler resistive index to reflect regulation of renal vascular tone during sepsis and acute kidney injury. Crit Care. 2012;16:R165. https://doi.org/10.1186/cc11517
- Huang D, Yang Z, Qiu L, Lin J, Cheng X. The predictive value of renal vascular resistance index and serum biomarkers for sepsis-associated acute kidney injury: a retrospective study. BMC Nephrol. 2025;26:208. https://doi.org/10.1186/s12882-025-04131-1
- Yang QH, Liu DW, Long Y, Liu HZ, Chai WZ, Wang XT. Acute renal failure during sepsis: potential role of cell cycle regulation. J Infect. 2009;58:459-64. https://doi.org/10.1016/j.jinf.2009.04.003
- Devarajan P. Update on mechanisms of ischemic acute kidney injury. J Am Soc Nephrol. 2006;17:1503-20. https://doi.org/10.1681/ASN.2006010017
- Seo DW, Li H, Qu CK, et al. Shp-1 mediates the antiproliferative activity of tissue inhibitor of metalloproteinase-2 in human microvascular endothelial cells. J Biol Chem. 2006;281:3711-21. https://doi.org/10.1074/jbc.M509932200
- Price PM, Safirstein RL, Megyesi J. The cell cycle and acute kidney injury. Kidney Int. 2009;76:604-13. https://doi.org/10.1038/ki.2009.224
- Peng ZY, Zhou F, Kellum JA. Cross-species validation of cell cycle arrest markers for acute kidney injury in the rat during sepsis. Intensive Care Med Exp. 2016;4:12. https://doi.org/10.1186/s40635-016-0086-1
- Honore PM, Joannes-Boyau O, Boer W, Janvier G, Gressens B. Acute kidney injury in the ICU: time has come for an early biomarker kit!. Acta Clin Belg. 2007;62(Suppl 2):318-21. https://doi.org/10.1179/acb.2007.072
- Godin M, Murray P, Mehta RL. Clinical approach to the patient with AKI and sepsis. Semin Nephrol. 2015;35:12-22. https://doi.org/10.1016/j.semnephrol.2015.01.003
- Kellum JA, Chawla LS, Keener C, et al. The effects of alternative resuscitation strategies on acute kidney injury in patients with septic shock. Am J Respir Crit Care Med. 2016;193:281-7. https://doi.org/10.1164/rccm.201505-0995OC
- Koyner JL, Shaw AD, Chawla LS, et al. Tissue Inhibitor Metalloproteinase-2 (TIMP-2)·IGF-Binding Protein-7 (IGFBP7) levels are associated with adverse long-term outcomes in patients with AKI. J Am Soc Nephrol. 2015;26:1747-54. https://doi.org/10.1681/ASN.2014060556
- Joannidis M, Forni LG, Haase M, et al. Use of cell cycle arrest biomarkers in conjunction with classical markers of acute kidney injury. Crit Care Med. 2019;47:e820-6. https://doi.org/10.1097/CCM.0000000000003907
- Arulkumaran N, Sixma ML, Jentho E, et al. Sequential analysis of a panel of biomarkers and pathologic findings in a resuscitated rat model of sepsis and recovery. Crit Care Med. 2017;45:e821-30. https://doi.org/10.1097/CCM.0000000000002381
- Zaouter C, Potvin J, Bats ML, Beauvieux MC, Remy A, Ouattara A. A combined approach for the early recognition of acute kidney injury after adult cardiac surgery. Anaesth Crit Care Pain Med. 2018;37:335-41. https://doi.org/10.1016/j.accpm.2018.05.001
- Zaouter C, Priem F, Leroux L, et al. New markers for early detection of acute kidney injury after transcatheter aortic valve implantation. Anaesth Crit Care Pain Med. 2018;37:319-26. https://doi.org/10.1016/j.accpm.2017.10.004
- Zaitoun T, Megahed M, Elghoneimy H, Emara DM, Elsayed I, Ahmed I. Renal arterial resistive index versus novel biomarkers for the early prediction of sepsis-associated acute kidney injury. Intern Emerg Med. 2024;19:971-81. https://doi.org/10.1007/s11739-024-03558-y
- Schnell D, Reynaud M, Venot M, et al. Resistive Index or color-Doppler semi-quantitative evaluation of renal perfusion by inexperienced physicians: results of a pilot study. Minerva Anestesiol. 2014;80:1273-81.
- Beloncle F, Rousseau N, Hamel JF, et al. Determinants of Doppler-based renal resistive index in patients with septic shock: impact of hemodynamic parameters, acute kidney injury and predisposing factors. Ann Intensive Care. 2019;9:51. https://doi.org/10.1186/s13613-019-0525-8
- Langenberg C, Gobe G, Hood S, May CN, Bellomo R. Renal histopathology during experimental septic acute kidney injury and recovery. Crit Care Med. 2014;42:e58-67. https://doi.org/10.1097/CCM.0b013e3182a639da
Copyright and license
Copyright © 2026 The Author(s). This is an open access article distributed under the Creative Commons Attribution License (CC BY), which permits unrestricted use, distribution, and reproduction in any medium or format, provided the original work is properly cited.